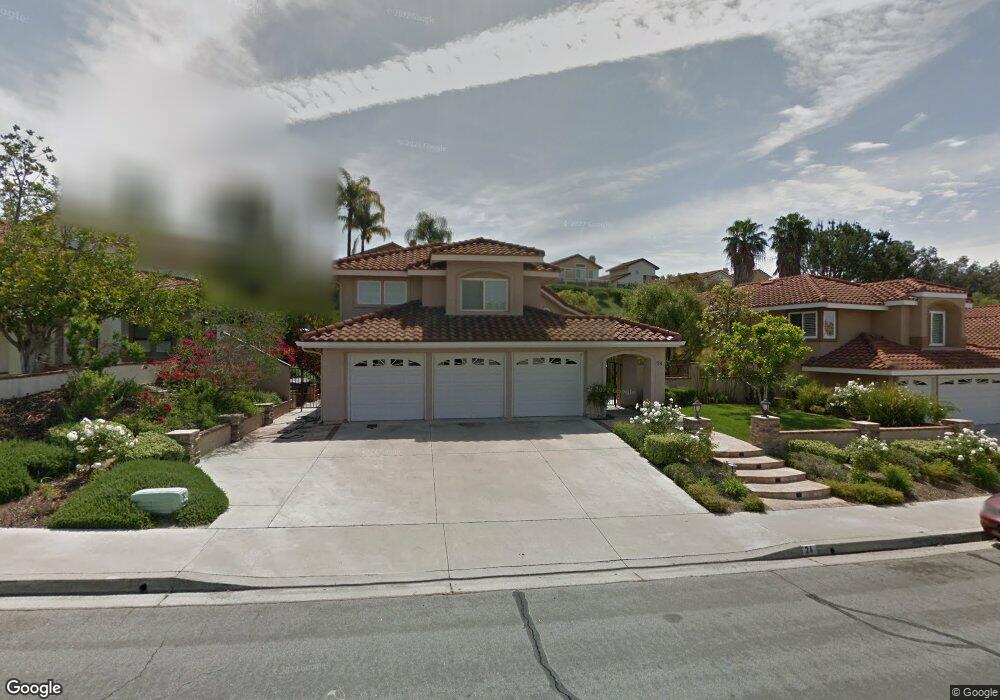
24 Santa Catrina Rancho Santa Margarita, CA 92688
Estimated Value: $1,310,787 - $1,500,000
3
Beds
3
Baths
2,405
Sq Ft
$572/Sq Ft
Est. Value
About This Home
This home is located at 24 Santa Catrina, Rancho Santa Margarita, CA 92688 and is currently estimated at $1,376,197, approximately $572 per square foot. 24 Santa Catrina is a home located in Orange County with nearby schools including Cielo Vista Elementary School, Rancho Santa Margarita Intermediate School, and Trabuco Hills High School.
Ownership History
Date
Name
Owned For
Owner Type
Purchase Details
Closed on
Dec 20, 2023
Sold by
Vedaa Robert E and Roy Jennifer
Bought by
Vedaa Roy Family Trust and Vedaa
Current Estimated Value
Purchase Details
Closed on
Nov 1, 2003
Sold by
Vedaa Robert E
Bought by
Vedaa Robert E and Roy Jennifer
Home Financials for this Owner
Home Financials are based on the most recent Mortgage that was taken out on this home.
Original Mortgage
$307,000
Interest Rate
5.72%
Mortgage Type
Purchase Money Mortgage
Purchase Details
Closed on
Jan 13, 1999
Sold by
Vielma Javier B and Vielma Maria V
Bought by
Vedaa Robert E
Home Financials for this Owner
Home Financials are based on the most recent Mortgage that was taken out on this home.
Original Mortgage
$235,600
Interest Rate
6.73%
Purchase Details
Closed on
Aug 17, 1990
Sold by
Vielma Javier B and Vielma Maria V
Bought by
Vielma Javier B and Vielma Maria
Create a Home Valuation Report for This Property
The Home Valuation Report is an in-depth analysis detailing your home's value as well as a comparison with similar homes in the area
Home Values in the Area
Average Home Value in this Area
Purchase History
| Date | Buyer | Sale Price | Title Company |
|---|---|---|---|
| Vedaa Roy Family Trust | -- | None Listed On Document | |
| Vedaa Robert E | -- | Ticor Title | |
| Vedaa Robert E | $294,500 | -- | |
| Vielma Javier B | -- | -- |
Source: Public Records
Mortgage History
| Date | Status | Borrower | Loan Amount |
|---|---|---|---|
| Previous Owner | Vedaa Robert E | $307,000 | |
| Previous Owner | Vedaa Robert E | $235,600 | |
| Closed | Vedaa Robert E | $169,470 |
Source: Public Records
Tax History Compared to Growth
Tax History
| Year | Tax Paid | Tax Assessment Tax Assessment Total Assessment is a certain percentage of the fair market value that is determined by local assessors to be the total taxable value of land and additions on the property. | Land | Improvement |
|---|---|---|---|---|
| 2025 | $4,643 | $461,682 | $197,283 | $264,399 |
| 2024 | $4,643 | $452,630 | $193,415 | $259,215 |
| 2023 | $4,534 | $443,755 | $189,622 | $254,133 |
| 2022 | $4,455 | $435,054 | $185,904 | $249,150 |
| 2021 | $3,434 | $426,524 | $182,259 | $244,265 |
| 2020 | $4,332 | $422,151 | $180,390 | $241,761 |
| 2019 | $4,609 | $413,874 | $176,853 | $237,021 |
| 2018 | $4,534 | $405,759 | $173,385 | $232,374 |
| 2017 | $4,539 | $397,803 | $169,985 | $227,818 |
| 2016 | $5,092 | $390,003 | $166,652 | $223,351 |
| 2015 | $5,256 | $384,145 | $164,148 | $219,997 |
| 2014 | $5,167 | $376,621 | $160,933 | $215,688 |
Source: Public Records
Map
Nearby Homes
- 52 Via Prado
- 98 Via Barcelona
- 45 Via Prado
- 12 Via Cordoba
- 20 Via Meseta
- 29 Via Pamplona Unit 78
- 41 Via Pamplona
- 71 Via Cresta
- 9 Via Cresta
- 7 Via Cresta Unit 117
- 12 Paseo Fucsia
- 31 Santa Agatha
- 3 De Soto Way
- 15 Temecula Ct
- 175 Calle de Los Ninos
- 74 Calle de Los Ninos
- 87 Calle de Felicidad
- 90 Calle de Felicidad Unit 215
- 12 El Vaquero
- 12 Paseo Vecino
- 22 Santa Catrina
- 26 Santa Catrina
- 20 Santa Catrina
- 30 Santa Catrina
- 21 Santa Isabel
- 19 Santa Isabel
- 18 Santa Catrina
- 17 Santa Isabel
- 23 Santa Catrina
- 32 Santa Catrina
- 25 Santa Catrina
- 15 Santa Isabel
- 27 Santa Catrina
- 25 Santa Isabel
- 21 Santa Catrina
- 16 Santa Catrina
- 29 Santa Catrina
- 34 Santa Catrina
- 13 Santa Isabel
- 19 Santa Catrina