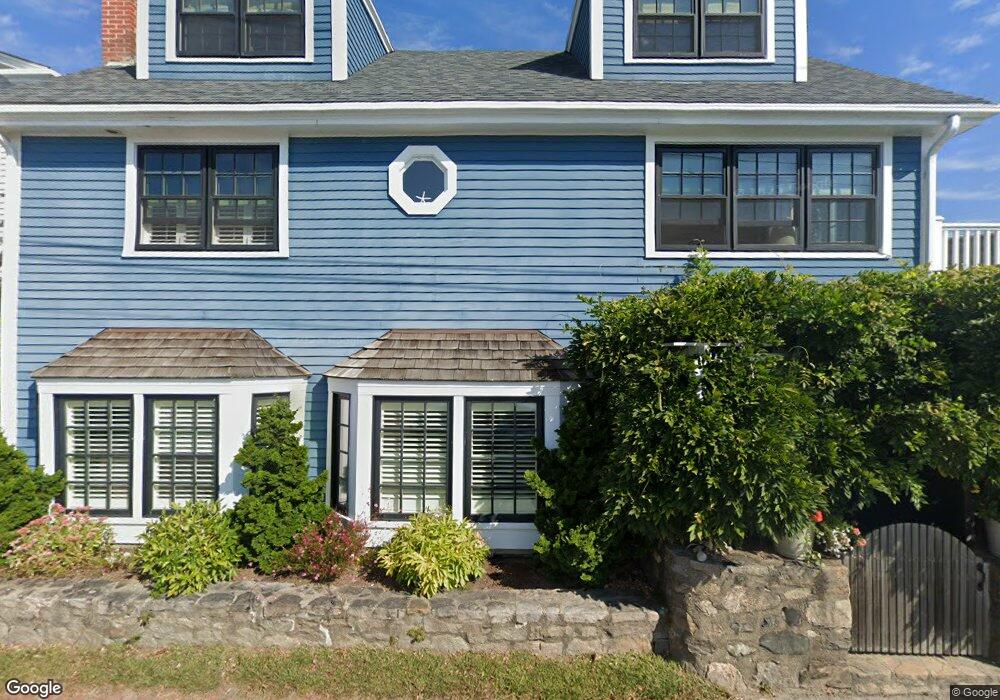
24 Wall St Stonington, CT 06378
Estimated Value: $1,185,000 - $1,830,481
4
Beds
4
Baths
2,847
Sq Ft
$546/Sq Ft
Est. Value
About This Home
This home is located at 24 Wall St, Stonington, CT 06378 and is currently estimated at $1,554,370, approximately $545 per square foot. 24 Wall St is a home located in New London County with nearby schools including Stonington Middle School, Stonington High School, and Pine Point School.
Ownership History
Date
Name
Owned For
Owner Type
Purchase Details
Closed on
Jul 8, 2015
Sold by
Tazzini 3Rd George B
Bought by
Neuman Paul and Neuman Debra
Current Estimated Value
Home Financials for this Owner
Home Financials are based on the most recent Mortgage that was taken out on this home.
Original Mortgage
$299,900
Outstanding Balance
$233,271
Interest Rate
3.87%
Mortgage Type
New Conventional
Estimated Equity
$1,321,099
Purchase Details
Closed on
Dec 30, 2003
Sold by
Petrie Charles
Bought by
Tazzini 3Rd George
Purchase Details
Closed on
May 27, 1994
Sold by
Mcclenahan Douglas S
Bought by
Janssens Paul B and Janssens Sarah
Create a Home Valuation Report for This Property
The Home Valuation Report is an in-depth analysis detailing your home's value as well as a comparison with similar homes in the area
Home Values in the Area
Average Home Value in this Area
Purchase History
| Date | Buyer | Sale Price | Title Company |
|---|---|---|---|
| Neuman Paul | $499,900 | -- | |
| Neuman Paul | $499,900 | -- | |
| Tazzini 3Rd George | $277,500 | -- | |
| Tazzini 3Rd George | $277,500 | -- | |
| Janssens Paul B | $290,000 | -- | |
| Janssens Paul B | $290,000 | -- |
Source: Public Records
Mortgage History
| Date | Status | Borrower | Loan Amount |
|---|---|---|---|
| Open | Neuman Paul | $299,900 | |
| Closed | Neuman Paul | $299,900 | |
| Previous Owner | Janssens Paul B | $300,000 | |
| Previous Owner | Janssens Paul B | $600,000 |
Source: Public Records
Tax History Compared to Growth
Tax History
| Year | Tax Paid | Tax Assessment Tax Assessment Total Assessment is a certain percentage of the fair market value that is determined by local assessors to be the total taxable value of land and additions on the property. | Land | Improvement |
|---|---|---|---|---|
| 2025 | $19,919 | $979,100 | $608,600 | $370,500 |
| 2024 | $19,092 | $979,100 | $608,600 | $370,500 |
| 2023 | $19,239 | $979,100 | $608,600 | $370,500 |
| 2022 | $19,054 | $714,700 | $441,000 | $273,700 |
| 2021 | $19,168 | $713,900 | $441,000 | $272,900 |
| 2020 | $18,373 | $697,000 | $441,000 | $256,000 |
| 2019 | $18,373 | $697,000 | $441,000 | $256,000 |
| 2018 | $17,829 | $697,000 | $441,000 | $256,000 |
| 2017 | $17,275 | $668,800 | $472,500 | $196,300 |
| 2016 | $16,794 | $668,800 | $472,500 | $196,300 |
| 2015 | $16,065 | $668,800 | $472,500 | $196,300 |
| 2014 | $15,336 | $668,800 | $472,500 | $196,300 |
Source: Public Records
Map
Nearby Homes