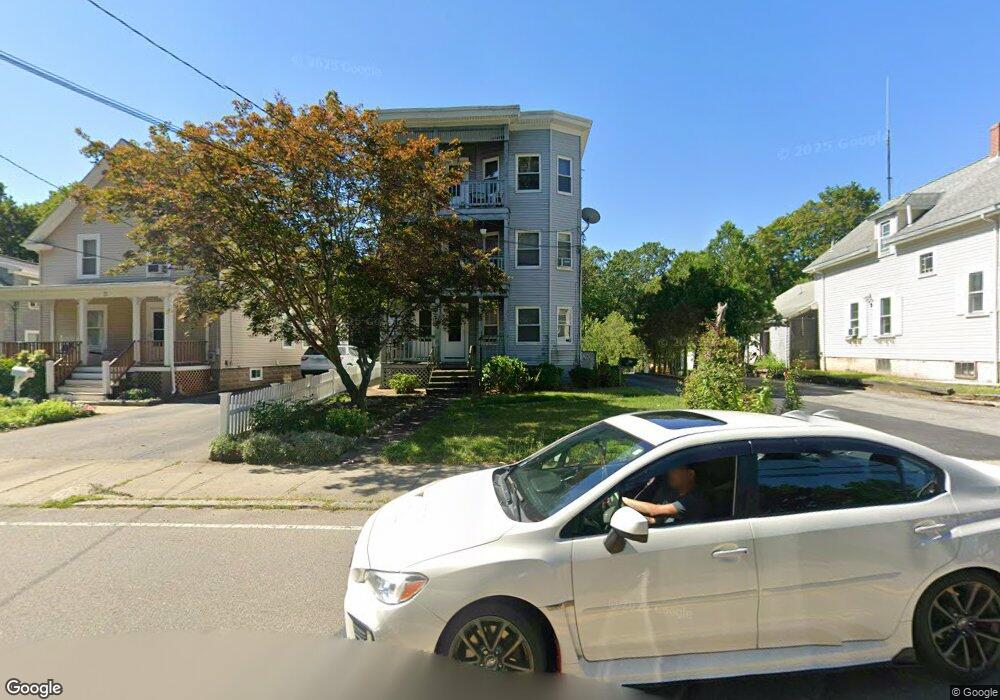
24 West St Attleboro, MA 02703
Estimated Value: $607,355 - $744,000
9
Beds
3
Baths
3,432
Sq Ft
$204/Sq Ft
Est. Value
About This Home
This home is located at 24 West St, Attleboro, MA 02703 and is currently estimated at $700,089, approximately $203 per square foot. 24 West St is a home located in Bristol County with nearby schools including Thomas E. Willett School, Cyril K. Brennan Middle School, and Attleboro High School.
Ownership History
Date
Name
Owned For
Owner Type
Purchase Details
Closed on
Aug 30, 2010
Sold by
Delia Celeste E and Delia Cosimo A
Bought by
Sun Jeremy S
Current Estimated Value
Home Financials for this Owner
Home Financials are based on the most recent Mortgage that was taken out on this home.
Original Mortgage
$256,545
Outstanding Balance
$170,519
Interest Rate
4.57%
Mortgage Type
Purchase Money Mortgage
Estimated Equity
$529,570
Create a Home Valuation Report for This Property
The Home Valuation Report is an in-depth analysis detailing your home's value as well as a comparison with similar homes in the area
Home Values in the Area
Average Home Value in this Area
Purchase History
| Date | Buyer | Sale Price | Title Company |
|---|---|---|---|
| Sun Jeremy S | $260,000 | -- |
Source: Public Records
Mortgage History
| Date | Status | Borrower | Loan Amount |
|---|---|---|---|
| Open | Sun Jeremy S | $256,545 |
Source: Public Records
Tax History Compared to Growth
Tax History
| Year | Tax Paid | Tax Assessment Tax Assessment Total Assessment is a certain percentage of the fair market value that is determined by local assessors to be the total taxable value of land and additions on the property. | Land | Improvement |
|---|---|---|---|---|
| 2025 | $7,846 | $625,200 | $141,200 | $484,000 |
| 2024 | $7,602 | $597,200 | $141,200 | $456,000 |
| 2023 | $6,844 | $499,900 | $128,500 | $371,400 |
| 2022 | $6,325 | $437,700 | $122,300 | $315,400 |
| 2021 | $4,437 | $415,000 | $117,700 | $297,300 |
| 2020 | $5,776 | $396,700 | $114,400 | $282,300 |
| 2019 | $4,213 | $386,900 | $112,300 | $274,600 |
| 2018 | $5,086 | $343,200 | $108,900 | $234,300 |
| 2017 | $3,660 | $346,400 | $108,900 | $237,500 |
| 2016 | $4,692 | $316,600 | $107,000 | $209,600 |
| 2015 | $4,448 | $302,400 | $107,000 | $195,400 |
| 2014 | $4,165 | $280,500 | $101,900 | $178,600 |
Source: Public Records
Map
Nearby Homes
- 392 N Main St
- 74 West St Unit 5
- 43 Elizabeth St
- 10 John St
- 62 Elizabeth St
- 29 Hodges St
- 140 N Main St Unit 3B
- 46 Berwick Rd
- 64 Mechanic St Unit 3
- 64 Mechanic St
- 17 1st St
- 46 Oak St
- 24 Park St Unit 4F
- 32 Park St Unit 4
- 0 Woodside Ave
- 63 Hope St
- 6 & 6R Holman St
- 8 Holman St
- 678 N Main St
- 10 Holman St Unit A