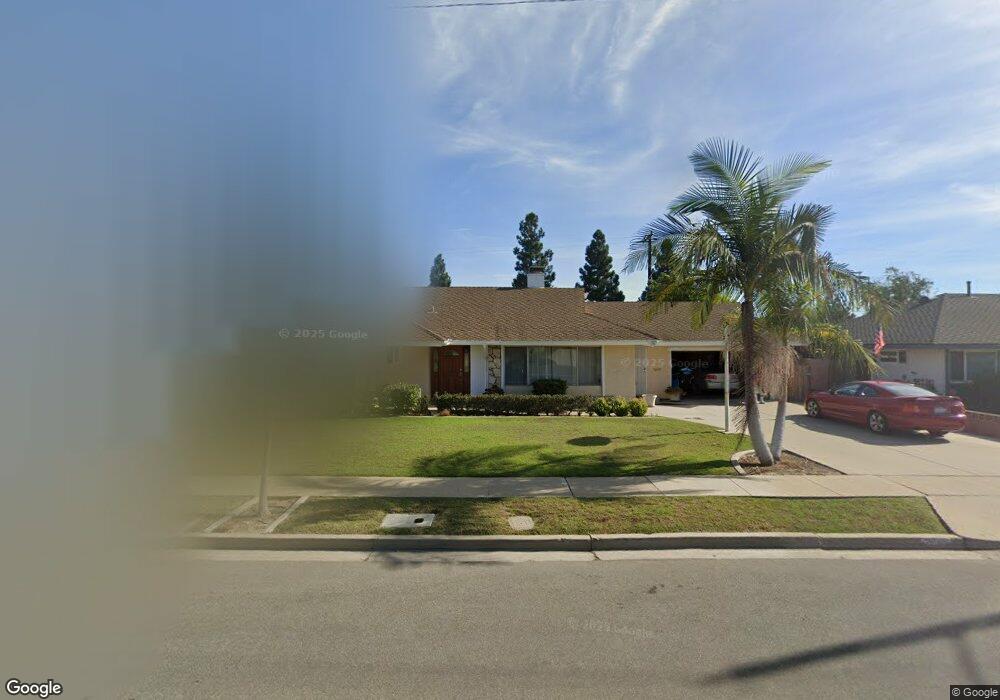
240 Calle Portilla Camarillo, CA 93010
Estimated Value: $894,031 - $1,101,000
3
Beds
3
Baths
1,578
Sq Ft
$634/Sq Ft
Est. Value
About This Home
This home is located at 240 Calle Portilla, Camarillo, CA 93010 and is currently estimated at $1,000,008, approximately $633 per square foot. 240 Calle Portilla is a home located in Ventura County with nearby schools including Las Posas Elementary School, Monte Vista Middle School, and Camarillo Academy of Progressive Education.
Ownership History
Date
Name
Owned For
Owner Type
Purchase Details
Closed on
Sep 25, 2020
Sold by
Derueda Cynthia Mcdaniel and Cynthia Mcdaniel Trust
Bought by
Derueda Cynthia Mcdaniel and Cynthia Mcdaniel Trust
Current Estimated Value
Home Financials for this Owner
Home Financials are based on the most recent Mortgage that was taken out on this home.
Original Mortgage
$212,000
Outstanding Balance
$188,563
Interest Rate
2.9%
Mortgage Type
New Conventional
Estimated Equity
$811,445
Purchase Details
Closed on
Jan 30, 2008
Sold by
Mcdaniel David L
Bought by
Mcdaniel Cynthia Lynn
Purchase Details
Closed on
Apr 22, 2003
Sold by
Mcdaniel Cynthia Lynn
Bought by
Mcdaniel Cynthia Lynn
Purchase Details
Closed on
May 22, 2002
Sold by
Gonzales Ben O and Gonzales Katherine T
Bought by
Mcdaniel Cynthia Lynn
Create a Home Valuation Report for This Property
The Home Valuation Report is an in-depth analysis detailing your home's value as well as a comparison with similar homes in the area
Home Values in the Area
Average Home Value in this Area
Purchase History
| Date | Buyer | Sale Price | Title Company |
|---|---|---|---|
| Derueda Cynthia Mcdaniel | -- | Consumers Title Company | |
| Mcdaniel Cynthia Lynn | -- | None Available | |
| Mcdaniel Cynthia Lynn | -- | -- | |
| Mcdaniel Cynthia Lynn | -- | -- | |
| Mcdaniel Cynthia Lynn | -- | -- |
Source: Public Records
Mortgage History
| Date | Status | Borrower | Loan Amount |
|---|---|---|---|
| Open | Derueda Cynthia Mcdaniel | $212,000 |
Source: Public Records
Tax History Compared to Growth
Tax History
| Year | Tax Paid | Tax Assessment Tax Assessment Total Assessment is a certain percentage of the fair market value that is determined by local assessors to be the total taxable value of land and additions on the property. | Land | Improvement |
|---|---|---|---|---|
| 2025 | $4,122 | $370,633 | $171,337 | $199,296 |
| 2024 | $4,122 | $363,366 | $167,977 | $195,389 |
| 2023 | $3,975 | $356,242 | $164,684 | $191,558 |
| 2022 | $3,963 | $349,257 | $161,455 | $187,802 |
| 2021 | $3,822 | $342,409 | $158,289 | $184,120 |
| 2020 | $3,808 | $338,900 | $156,667 | $182,233 |
| 2019 | $3,791 | $332,256 | $153,596 | $178,660 |
| 2018 | $3,722 | $325,742 | $150,585 | $175,157 |
| 2017 | $3,504 | $319,356 | $147,633 | $171,723 |
| 2016 | $3,421 | $313,095 | $144,739 | $168,356 |
| 2015 | $3,386 | $308,394 | $142,566 | $165,828 |
| 2014 | $3,308 | $302,355 | $139,774 | $162,581 |
Source: Public Records
Map
Nearby Homes
- 51 Calle Escalon
- 73 Paseo Esplendido
- 106 Calle Bella Vista
- 308 Calle Converse
- 813 N Calle Circulo
- 85 Crestview Ave
- 166 Bramble Ct
- 1075 Seybolt Ave
- 25 Encino Ave
- 858 Calle Portilla
- 1665 Avenida Soltura
- 860 Big Horn Ct
- 756 Edward Scholle Dr
- 808 N Highland Dr
- 800 Calle Higuera
- 170 Spanish Moss Place
- 405 Paseo Del Valle
- 170 Sawbuck St
- 1974 Sierra Mesa Dr
- 220 Camino Cortina
- 258 Calle Portilla
- 224 Calle Portilla
- 274 Calle Portilla
- 208 Calle Portilla
- 249 Calle Portilla
- 235 Calle Portilla
- 261 Calle Portilla
- 221 Calle Portilla
- 290 Calle Portilla
- 273 Calle Portilla
- 60 Camino la Madera
- 258 Calle Navarro
- 264 Calle Navarro
- 295 Calle Portilla
- 240 Calle Navarro
- 308 Calle Portilla
- 13 Camino la Madera
- 286 Calle Navarro
- 224 Calle Navarro
- 39 Camino la Madera