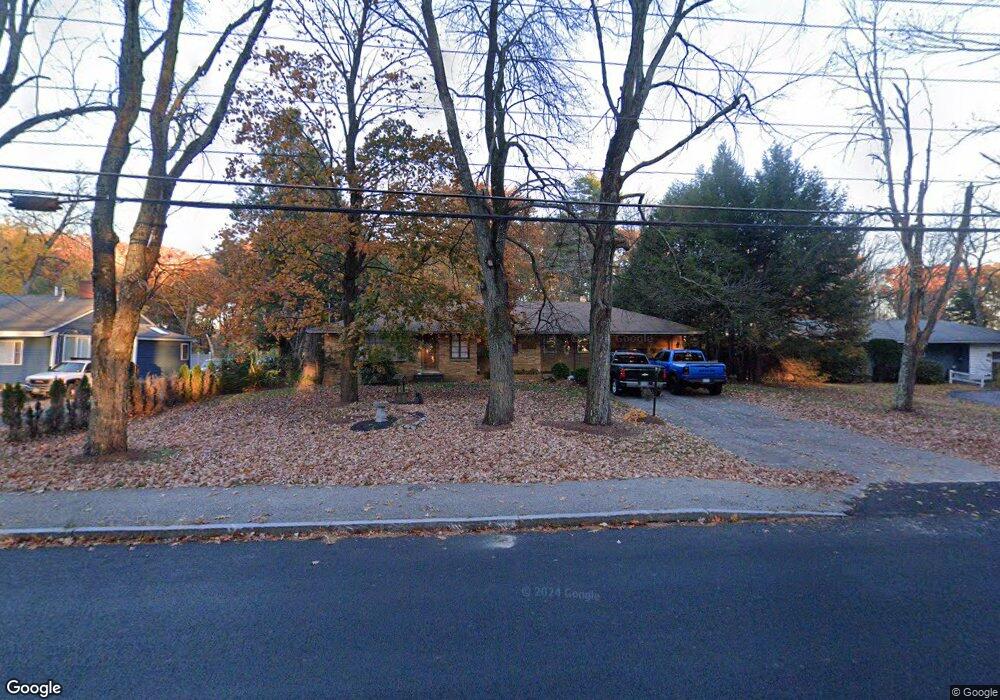
240 Huse Rd Manchester, NH 03103
Southside NeighborhoodEstimated Value: $401,000 - $461,000
2
Beds
1
Bath
1,744
Sq Ft
$252/Sq Ft
Est. Value
About This Home
This home is located at 240 Huse Rd, Manchester, NH 03103 and is currently estimated at $439,603, approximately $252 per square foot. 240 Huse Rd is a home located in Hillsborough County with nearby schools including Henry J. McLaughlin Middle School, Manchester Memorial High School, and The Founders Academy Charter School (El).
Ownership History
Date
Name
Owned For
Owner Type
Purchase Details
Closed on
Feb 23, 2010
Sold by
Fnma
Bought by
Champagne Richard A and Champagne Shirley M
Current Estimated Value
Home Financials for this Owner
Home Financials are based on the most recent Mortgage that was taken out on this home.
Original Mortgage
$180,175
Outstanding Balance
$120,078
Interest Rate
5.17%
Mortgage Type
Purchase Money Mortgage
Estimated Equity
$319,525
Purchase Details
Closed on
Oct 22, 2009
Sold by
Lavery Steven and Fnma
Bought by
Federal National Mortgage Association
Purchase Details
Closed on
May 15, 1998
Sold by
Laflamme Est Stella J
Bought by
Lavery Steven W and Lavery Francine J
Home Financials for this Owner
Home Financials are based on the most recent Mortgage that was taken out on this home.
Original Mortgage
$70,000
Interest Rate
7.08%
Mortgage Type
Purchase Money Mortgage
Create a Home Valuation Report for This Property
The Home Valuation Report is an in-depth analysis detailing your home's value as well as a comparison with similar homes in the area
Home Values in the Area
Average Home Value in this Area
Purchase History
| Date | Buyer | Sale Price | Title Company |
|---|---|---|---|
| Champagne Richard A | $183,500 | -- | |
| Federal National Mortgage Association | $225,500 | -- | |
| Lavery Steven W | $87,500 | -- |
Source: Public Records
Mortgage History
| Date | Status | Borrower | Loan Amount |
|---|---|---|---|
| Open | Lavery Steven W | $180,175 | |
| Previous Owner | Lavery Steven W | $208,000 | |
| Previous Owner | Lavery Steven W | $70,000 |
Source: Public Records
Tax History Compared to Growth
Tax History
| Year | Tax Paid | Tax Assessment Tax Assessment Total Assessment is a certain percentage of the fair market value that is determined by local assessors to be the total taxable value of land and additions on the property. | Land | Improvement |
|---|---|---|---|---|
| 2024 | $6,129 | $313,000 | $119,500 | $193,500 |
| 2023 | $5,903 | $313,000 | $119,500 | $193,500 |
| 2022 | $5,709 | $313,000 | $119,500 | $193,500 |
| 2021 | $5,534 | $313,000 | $119,500 | $193,500 |
| 2020 | $5,085 | $206,200 | $82,400 | $123,800 |
| 2019 | $5,015 | $206,200 | $82,400 | $123,800 |
| 2018 | $4,883 | $206,200 | $82,400 | $123,800 |
| 2017 | $4,809 | $206,200 | $82,400 | $123,800 |
| 2016 | $4,771 | $206,200 | $82,400 | $123,800 |
| 2015 | $4,789 | $204,300 | $76,300 | $128,000 |
| 2014 | $4,801 | $204,300 | $76,300 | $128,000 |
| 2013 | $4,631 | $204,300 | $76,300 | $128,000 |
Source: Public Records
Map
Nearby Homes