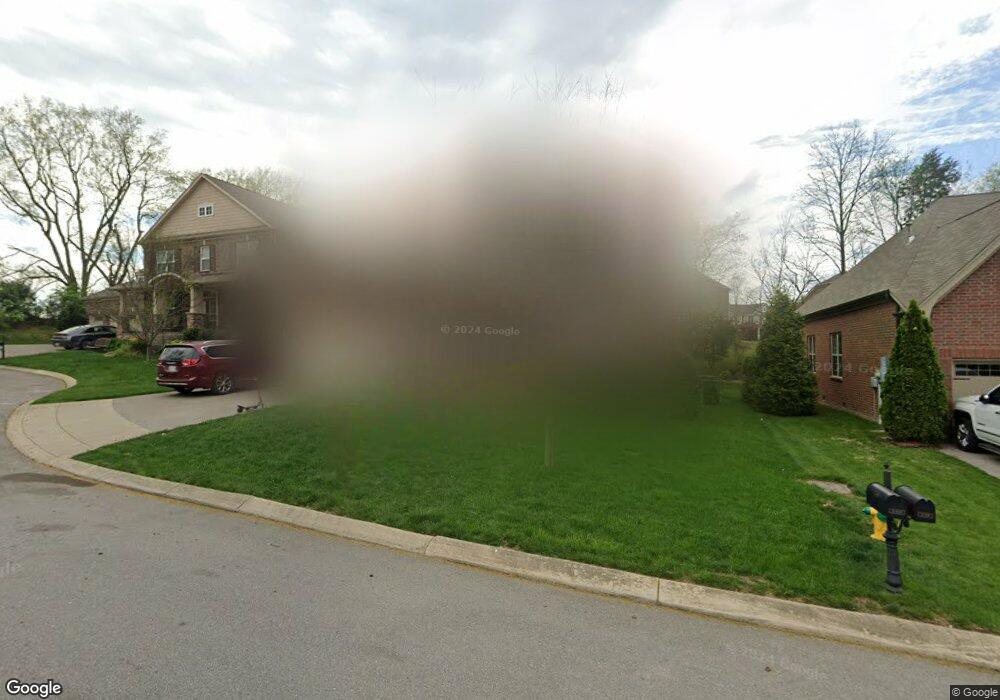
240 Sterling Woods Dr Unit L-20 Mount Juliet, TN 37122
Estimated Value: $705,102 - $782,000
4
Beds
3
Baths
3,306
Sq Ft
$225/Sq Ft
Est. Value
About This Home
This home is located at 240 Sterling Woods Dr Unit L-20, Mount Juliet, TN 37122 and is currently estimated at $744,276, approximately $225 per square foot. 240 Sterling Woods Dr Unit L-20 is a home located in Wilson County with nearby schools including Rutland Elementary School, Gladeville Middle School, and Wilson Central High School.
Ownership History
Date
Name
Owned For
Owner Type
Purchase Details
Closed on
Jul 31, 2023
Sold by
Opendoor Property Trust
Bought by
Thomason Ryan Edward and Thomason Monserrat
Current Estimated Value
Home Financials for this Owner
Home Financials are based on the most recent Mortgage that was taken out on this home.
Original Mortgage
$650,750
Outstanding Balance
$635,531
Interest Rate
6.67%
Mortgage Type
New Conventional
Estimated Equity
$108,745
Purchase Details
Closed on
Oct 25, 2022
Sold by
Veeramachaneni Sree Harsha
Bought by
Opendoor Property Trust
Purchase Details
Closed on
Mar 27, 2015
Sold by
The Jones Co Of Tennessee Llc
Bought by
Veeramachaneni Sree Harsha
Home Financials for this Owner
Home Financials are based on the most recent Mortgage that was taken out on this home.
Original Mortgage
$362,109
Interest Rate
3.89%
Mortgage Type
New Conventional
Purchase Details
Closed on
Sep 25, 2013
Create a Home Valuation Report for This Property
The Home Valuation Report is an in-depth analysis detailing your home's value as well as a comparison with similar homes in the area
Home Values in the Area
Average Home Value in this Area
Purchase History
| Date | Buyer | Sale Price | Title Company |
|---|---|---|---|
| Thomason Ryan Edward | $685,000 | Tennessee Title Services | |
| Opendoor Property Trust | $707,400 | -- | |
| Veeramachaneni Sree Harsha | $381,167 | -- | |
| -- | $1,208,100 | -- |
Source: Public Records
Mortgage History
| Date | Status | Borrower | Loan Amount |
|---|---|---|---|
| Open | Thomason Ryan Edward | $650,750 | |
| Previous Owner | Veeramachaneni Sree Harsha | $362,109 |
Source: Public Records
Tax History Compared to Growth
Tax History
| Year | Tax Paid | Tax Assessment Tax Assessment Total Assessment is a certain percentage of the fair market value that is determined by local assessors to be the total taxable value of land and additions on the property. | Land | Improvement |
|---|---|---|---|---|
| 2024 | $2,401 | $125,775 | $18,750 | $107,025 |
| 2022 | $2,401 | $125,775 | $18,750 | $107,025 |
| 2021 | $2,539 | $125,775 | $18,750 | $107,025 |
| 2020 | $3,049 | $125,775 | $18,750 | $107,025 |
| 2019 | $376 | $113,150 | $23,000 | $90,150 |
| 2018 | $3,038 | $113,150 | $23,000 | $90,150 |
| 2017 | $3,038 | $113,150 | $23,000 | $90,150 |
| 2016 | $3,038 | $113,150 | $23,000 | $90,150 |
| 2015 | $3,135 | $113,150 | $23,000 | $90,150 |
Source: Public Records
Map
Nearby Homes
- 120 Southern Way Blvd
- 609 Heritage Dr
- 105 Brookcliff Dr
- Ashford Plan at Waterford Park
- Ellington Plan at Waterford Park
- Weston Plan at Waterford Park
- Landon Plan at Waterford Park
- 107 Brookcliff Dr
- Harper Plan at Waterford Park
- 102 Drummers Way
- 304 Blackland Dr
- 2402 Delta Cir
- 215 S Dunnwood Ln
- 227 S Dunnwood Ln
- 532 Millwood Ln
- 537 Millwood Ln
- 602 Brigadier St
- 424 Everlee Ln
- 1154 Bastion Cir
- 220 Old Towne Dr
- 240 Sterling Woods Dr
- 240 Sterling Woods Dr
- 238 Sterling Woods Dr
- 238 Sterling Woods Dr Unit L-19
- 242 Sterling Woods Dr
- 728 Crestmark Dr
- 239 Sterling Woods Dr
- 236 Sterling Woods Dr
- 236 Sterling Woods Dr Unit L-18
- 726 Crestmark Dr
- 445 Sterling Woods Dr
- 241 Sterling Woods Dr Unit L-23
- 729 Crestmark Dr
- 243 Sterling Woods Dr
- 243 Sterling Woods Dr Unit L-22
- 449 Valley Spring Dr
- 234 Sterling Woods Dr Unit L-17
- 449 Valley Spring Dr
- 234 Sterling Woods Dr
- 724 Crestmark Dr