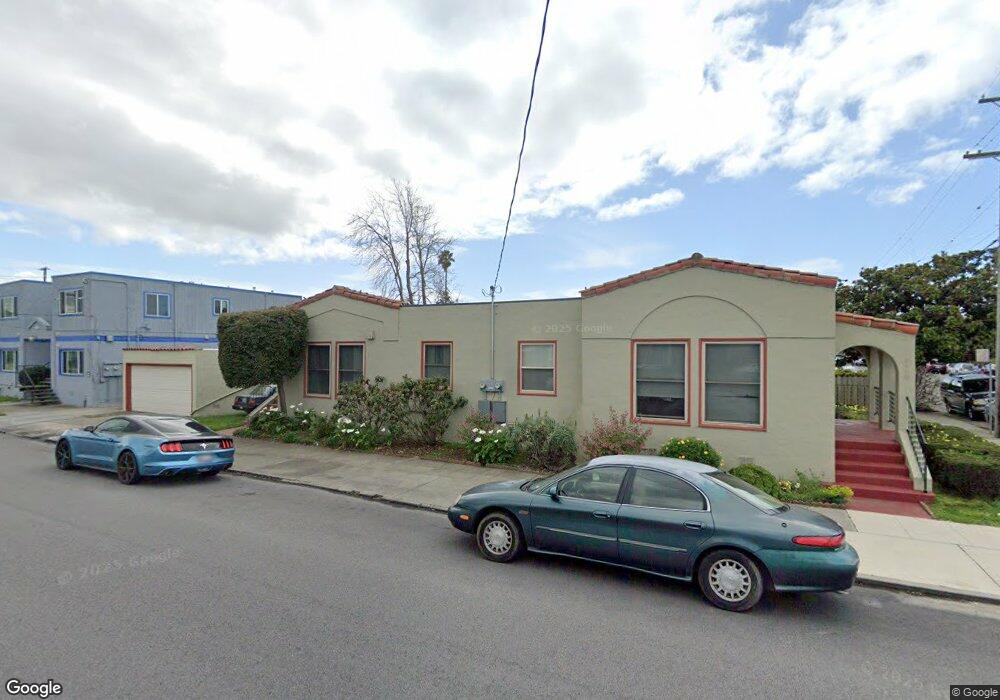
2400 Roosevelt Ave Richmond, CA 94804
North & East NeighborhoodEstimated Value: $571,000 - $778,748
4
Beds
2
Baths
2,076
Sq Ft
$335/Sq Ft
Est. Value
About This Home
This home is located at 2400 Roosevelt Ave, Richmond, CA 94804 and is currently estimated at $694,687, approximately $334 per square foot. 2400 Roosevelt Ave is a home located in Contra Costa County with nearby schools including Michelle Obama School, Lovonya DeJean Middle School, and John F. Kennedy High School.
Ownership History
Date
Name
Owned For
Owner Type
Purchase Details
Closed on
Jan 13, 2000
Sold by
George Sims and Sims Margaret M
Bought by
Sims Sharon
Current Estimated Value
Home Financials for this Owner
Home Financials are based on the most recent Mortgage that was taken out on this home.
Original Mortgage
$131,400
Outstanding Balance
$42,126
Interest Rate
7.96%
Mortgage Type
Stand Alone First
Estimated Equity
$652,561
Purchase Details
Closed on
Sep 22, 1999
Sold by
Leedie Michael
Bought by
Sims Sharon
Create a Home Valuation Report for This Property
The Home Valuation Report is an in-depth analysis detailing your home's value as well as a comparison with similar homes in the area
Home Values in the Area
Average Home Value in this Area
Purchase History
| Date | Buyer | Sale Price | Title Company |
|---|---|---|---|
| Sims Sharon | -- | Old Republic Title Company | |
| Sims Sharon | -- | Old Republic Title Company |
Source: Public Records
Mortgage History
| Date | Status | Borrower | Loan Amount |
|---|---|---|---|
| Open | Sims Sharon | $131,400 |
Source: Public Records
Tax History Compared to Growth
Tax History
| Year | Tax Paid | Tax Assessment Tax Assessment Total Assessment is a certain percentage of the fair market value that is determined by local assessors to be the total taxable value of land and additions on the property. | Land | Improvement |
|---|---|---|---|---|
| 2025 | $5,850 | $237,610 | $90,368 | $147,242 |
| 2024 | $5,662 | $232,952 | $88,597 | $144,355 |
| 2023 | $5,662 | $228,385 | $86,860 | $141,525 |
| 2022 | $5,508 | $223,907 | $85,157 | $138,750 |
| 2021 | $5,394 | $219,518 | $83,488 | $136,030 |
| 2019 | $5,051 | $213,009 | $81,012 | $131,997 |
| 2018 | $4,862 | $208,833 | $79,424 | $129,409 |
| 2017 | $4,726 | $204,739 | $77,867 | $126,872 |
| 2016 | $4,624 | $200,726 | $76,341 | $124,385 |
| 2015 | $4,558 | $197,712 | $75,195 | $122,517 |
| 2014 | $4,543 | $193,841 | $73,723 | $120,118 |
Source: Public Records
Map
Nearby Homes