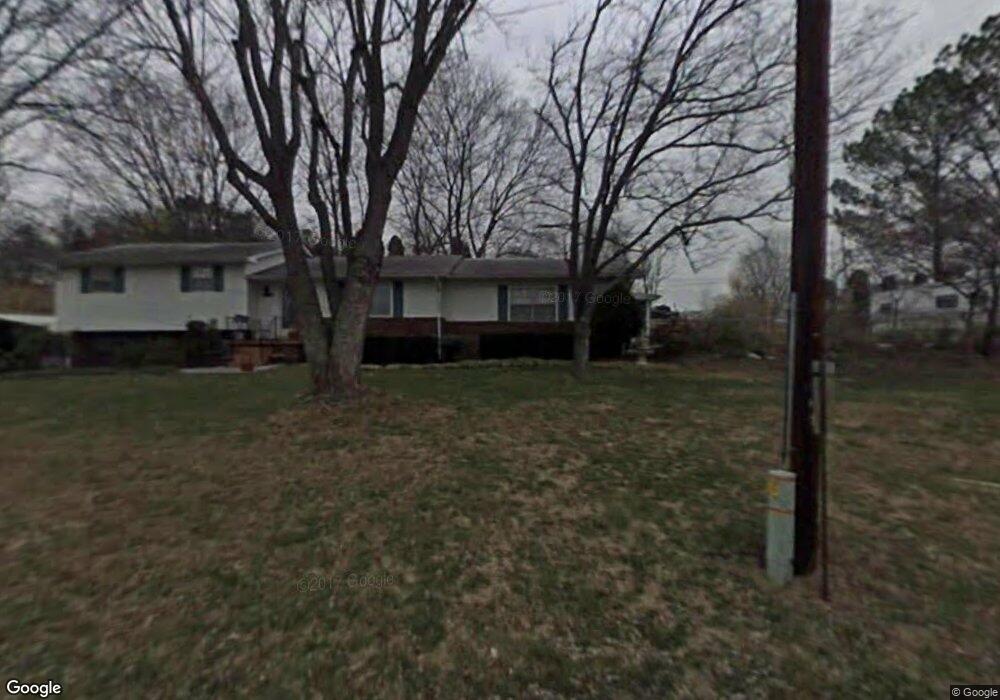
2405 Raritan Dr Morristown, TN 37813
Estimated Value: $145,319 - $253,000
3
Beds
2
Baths
1,512
Sq Ft
$136/Sq Ft
Est. Value
About This Home
This home is located at 2405 Raritan Dr, Morristown, TN 37813 and is currently estimated at $205,580, approximately $135 per square foot. 2405 Raritan Dr is a home located in Hamblen County with nearby schools including Union Heights Elementary School, East Ridge Middle School, and Morristown East High School.
Ownership History
Date
Name
Owned For
Owner Type
Purchase Details
Closed on
Jan 31, 2017
Sold by
Harris David K
Bought by
Williamson James E
Current Estimated Value
Home Financials for this Owner
Home Financials are based on the most recent Mortgage that was taken out on this home.
Original Mortgage
$64,313
Outstanding Balance
$53,249
Interest Rate
4.2%
Mortgage Type
FHA
Estimated Equity
$152,331
Purchase Details
Closed on
Jul 1, 2008
Sold by
Susan Greene
Bought by
Harris David K
Purchase Details
Closed on
Aug 22, 2005
Bought by
Greene Susan
Purchase Details
Closed on
May 27, 2005
Bought by
Williamson Trent Deborah
Purchase Details
Closed on
Apr 9, 1998
Bought by
Greene Susan
Purchase Details
Closed on
Aug 26, 1992
Bought by
Williamson Betty and Williamson James E
Purchase Details
Closed on
Oct 8, 1990
Bought by
Williamson James E and Kennetta Pr
Purchase Details
Closed on
Jun 7, 1974
Bought by
Williamson James E and Williamson Betty
Create a Home Valuation Report for This Property
The Home Valuation Report is an in-depth analysis detailing your home's value as well as a comparison with similar homes in the area
Home Values in the Area
Average Home Value in this Area
Purchase History
| Date | Buyer | Sale Price | Title Company |
|---|---|---|---|
| Williamson James E | $65,500 | -- | |
| Harris David K | $75,000 | -- | |
| Greene Susan | -- | -- | |
| Williamson Trent Deborah | -- | -- | |
| Greene Susan | $5,400 | -- | |
| Williamson Betty | $3,700 | -- | |
| Williamson James E | $2,500 | -- | |
| Williamson James E | $1,500 | -- |
Source: Public Records
Mortgage History
| Date | Status | Borrower | Loan Amount |
|---|---|---|---|
| Open | Williamson James E | $64,313 |
Source: Public Records
Tax History Compared to Growth
Tax History
| Year | Tax Paid | Tax Assessment Tax Assessment Total Assessment is a certain percentage of the fair market value that is determined by local assessors to be the total taxable value of land and additions on the property. | Land | Improvement |
|---|---|---|---|---|
| 2024 | $431 | $21,900 | $5,325 | $16,575 |
| 2023 | $431 | $21,900 | $0 | $0 |
| 2022 | $431 | $21,900 | $5,325 | $16,575 |
| 2021 | $431 | $21,900 | $5,325 | $16,575 |
| 2020 | $431 | $21,900 | $5,325 | $16,575 |
| 2019 | $396 | $18,600 | $4,000 | $14,600 |
| 2018 | $396 | $18,600 | $4,000 | $14,600 |
| 2017 | $396 | $18,600 | $4,000 | $14,600 |
| 2016 | $370 | $18,600 | $4,000 | $14,600 |
| 2015 | $344 | $18,600 | $4,000 | $14,600 |
| 2014 | -- | $18,600 | $4,000 | $14,600 |
| 2013 | -- | $20,600 | $0 | $0 |
Source: Public Records
Map
Nearby Homes
- 2395 Raritan Dr
- 2435 Raritan Dr
- 2365 Raritan Dr
- 3095 Fish Hatchery Rd
- 2315 Raritan Dr
- 2400 Raritan Dr
- 2430 Raritan Dr
- 2350 Raritan Dr
- 3141 Fish Hatchery Rd
- 0 Fish Hatchery Rd Unit 554531
- 0 Fish Hatchery Rd Unit 612047
- 2295 Raritan Dr
- 3118 Lon Cir
- 3104 Lon Cir
- 3120 Lon Cir
- 3065 Fish Hatchery Rd
- 2305 Herron Dr
- 3108 Fish Hatchery Rd
- 2290 Raritan Dr
- 3050 Sugar Maples St