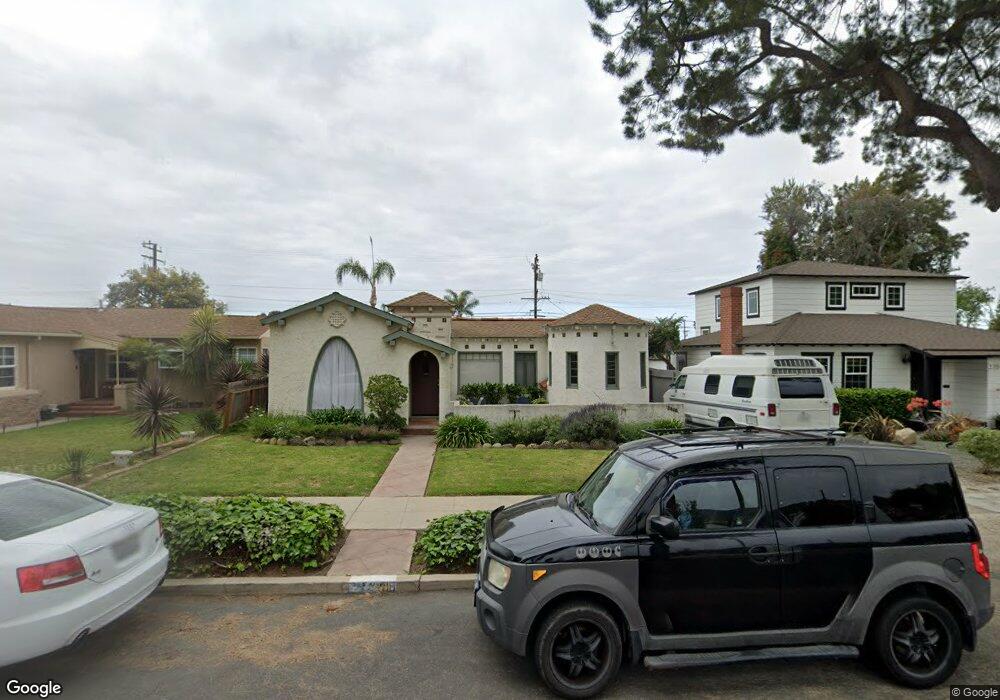
2408 Lexington Dr Ventura, CA 93003
Midtown NeighborhoodEstimated Value: $807,320 - $1,125,000
3
Beds
1
Bath
1,096
Sq Ft
$941/Sq Ft
Est. Value
About This Home
This home is located at 2408 Lexington Dr, Ventura, CA 93003 and is currently estimated at $1,030,830, approximately $940 per square foot. 2408 Lexington Dr is a home located in Ventura County with nearby schools including Loma Vista Elementary School, Cabrillo Middle School, and Ventura High School.
Ownership History
Date
Name
Owned For
Owner Type
Purchase Details
Closed on
Sep 20, 2021
Sold by
Mclaren Margaret Perley and Perley James Morrison
Bought by
Perley James Morrison and Mclaren Margaret Perley
Current Estimated Value
Purchase Details
Closed on
Jun 3, 2021
Sold by
Latham Perley Jacqueline
Bought by
Perley Family Trust
Purchase Details
Closed on
Jan 19, 2021
Sold by
Latham Perley Jacqueline
Bought by
Perley Family Trust
Purchase Details
Closed on
Jan 17, 2021
Sold by
Perley James Morrison
Bought by
Perley James Morrison and James Morrison Perley Trust
Purchase Details
Closed on
Nov 11, 2019
Sold by
Mclaren Margaret Perley and Mclaren William Gordon
Bought by
Mclaren Margaret P and The Margaret P Mclaren Separte
Purchase Details
Closed on
Sep 21, 2011
Sold by
Perley James B and Perley Jacqueline L
Bought by
Mclaren Margaret Perley and Perley James Morrison
Purchase Details
Closed on
Dec 19, 2008
Sold by
Perley James B
Bought by
Perley James B and Perley Jacqueline L
Purchase Details
Closed on
Jul 27, 1998
Sold by
Perley Hilda A Trust and James B
Bought by
Perley James B
Create a Home Valuation Report for This Property
The Home Valuation Report is an in-depth analysis detailing your home's value as well as a comparison with similar homes in the area
Home Values in the Area
Average Home Value in this Area
Purchase History
| Date | Buyer | Sale Price | Title Company |
|---|---|---|---|
| Perley James Morrison | -- | None Available | |
| Perley Family Trust | -- | -- | |
| Perley Family Trust | -- | -- | |
| Perley James Morrison | -- | None Available | |
| Mclaren Margaret P | -- | None Available | |
| Mclaren Margaret Perley | -- | None Available | |
| Perley James B | -- | None Available | |
| Perley James B | -- | -- |
Source: Public Records
Tax History Compared to Growth
Tax History
| Year | Tax Paid | Tax Assessment Tax Assessment Total Assessment is a certain percentage of the fair market value that is determined by local assessors to be the total taxable value of land and additions on the property. | Land | Improvement |
|---|---|---|---|---|
| 2025 | $624 | $47,739 | $22,031 | $25,708 |
| 2024 | $624 | $46,803 | $21,599 | $25,204 |
| 2023 | $617 | $45,886 | $21,176 | $24,710 |
| 2022 | $582 | $44,987 | $20,761 | $24,226 |
| 2021 | $573 | $44,105 | $20,354 | $23,751 |
| 2020 | $568 | $43,655 | $20,147 | $23,508 |
| 2019 | $559 | $42,800 | $19,752 | $23,048 |
| 2018 | $552 | $41,962 | $19,365 | $22,597 |
| 2017 | $542 | $41,140 | $18,986 | $22,154 |
| 2016 | $533 | $40,334 | $18,614 | $21,720 |
| 2015 | $529 | $39,731 | $18,336 | $21,395 |
| 2014 | $522 | $38,955 | $17,978 | $20,977 |
Source: Public Records
Map
Nearby Homes
- 2418 Lexington Dr
- 69 S Seaward Ave
- 2542 Poli St
- Plan D at Portalvo - Townhomes
- Plan F at Portalvo - Townhomes
- Plan E at Portalvo - Townhomes
- Plan O at Portalvo - Condos/Flats
- Plan A at Portalvo - Townhomes
- Plan H at Portalvo - Condos/Flats
- Plan L at Portalvo - Condos/Flats
- Plan C at Portalvo - Townhomes
- Plan B at Portalvo - Townhomes
- Plan J at Portalvo - Condos/Flats
- Plan G at Portalvo - Townhomes
- Plan N at Portalvo - Condos/Flats
- Plan K at Portalvo - Condos/Flats
- Plan M at Portalvo - Condos/Flats
- 66 San Clemente St
- 205 Jordan Ave
- 44 Coronado St Unit 202
- 2396 Lexington Dr
- 2430 Lexington Dr
- 2384 Lexington Dr
- 2444 Lexington Dr
- 54 N Seaward Ave
- 54 N Seaward Ave
- 2420 Mckinley Dr
- 2456 Lexington Dr
- 0 Seaward Unit RN-6262
- 0 Seaward Unit RN-6260
- 2451 Lexington Dr
- 2385 Mckinley Dr
- 2468 Lexington Dr
- 2407 Mckinley Dr
- 2417 Mckinley Dr
- 2344 Lexington Dr
- 2480 Lexington Dr
- 2446 Mckinley Dr
- 2427 Mckinley Dr
- 2332 Lexington Dr