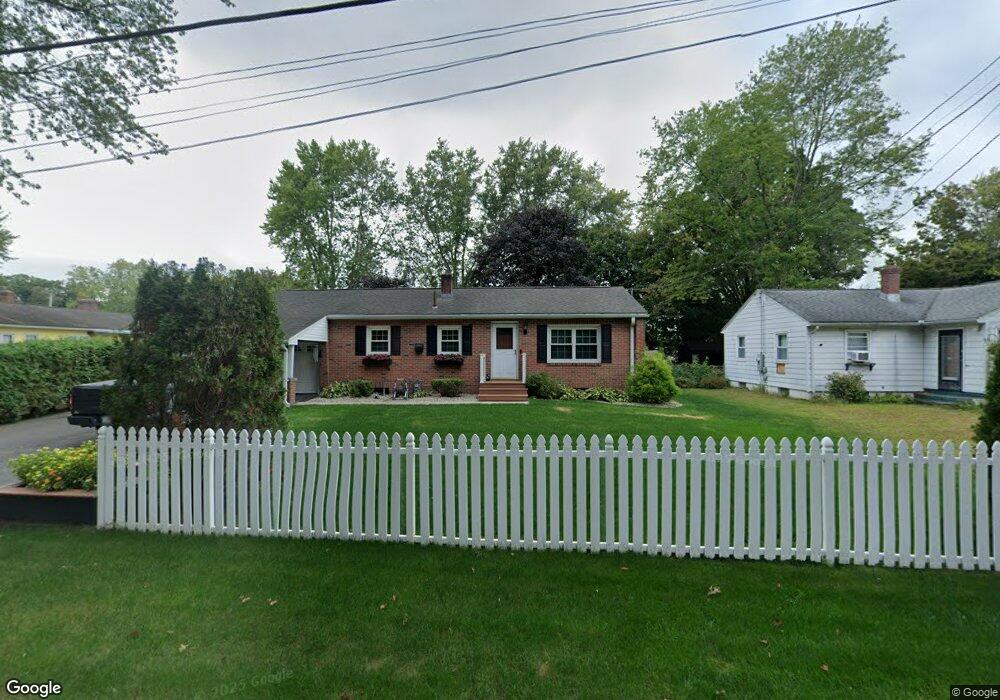
241 East St South Hadley, MA 01075
Estimated Value: $355,000 - $368,000
3
Beds
1
Bath
1,454
Sq Ft
$248/Sq Ft
Est. Value
About This Home
This home is located at 241 East St, South Hadley, MA 01075 and is currently estimated at $360,783, approximately $248 per square foot. 241 East St is a home located in Hampshire County with nearby schools including Plains Elementary School, Mosier Elementary School, and Michael E. Smith Middle School.
Ownership History
Date
Name
Owned For
Owner Type
Purchase Details
Closed on
Sep 24, 1997
Sold by
Snyder Joseph L and Snyder Judith F
Bought by
Calhoun Lisa A and Calhoun Ronald L
Current Estimated Value
Home Financials for this Owner
Home Financials are based on the most recent Mortgage that was taken out on this home.
Original Mortgage
$97,750
Outstanding Balance
$15,732
Interest Rate
7.47%
Mortgage Type
Purchase Money Mortgage
Estimated Equity
$345,051
Create a Home Valuation Report for This Property
The Home Valuation Report is an in-depth analysis detailing your home's value as well as a comparison with similar homes in the area
Home Values in the Area
Average Home Value in this Area
Purchase History
| Date | Buyer | Sale Price | Title Company |
|---|---|---|---|
| Calhoun Lisa A | $102,900 | -- |
Source: Public Records
Mortgage History
| Date | Status | Borrower | Loan Amount |
|---|---|---|---|
| Open | Calhoun Lisa A | $97,750 |
Source: Public Records
Tax History Compared to Growth
Tax History
| Year | Tax Paid | Tax Assessment Tax Assessment Total Assessment is a certain percentage of the fair market value that is determined by local assessors to be the total taxable value of land and additions on the property. | Land | Improvement |
|---|---|---|---|---|
| 2025 | $4,895 | $307,300 | $106,700 | $200,600 |
| 2024 | $4,890 | $293,700 | $99,800 | $193,900 |
| 2023 | $4,653 | $265,100 | $90,600 | $174,500 |
| 2022 | $4,437 | $240,100 | $90,600 | $149,500 |
| 2021 | $5,695 | $224,500 | $84,700 | $139,800 |
| 2020 | $5,596 | $214,800 | $84,700 | $130,100 |
| 2019 | $4,149 | $205,900 | $80,600 | $125,300 |
| 2018 | $5,155 | $195,500 | $78,200 | $117,300 |
| 2017 | $3,760 | $186,900 | $78,200 | $108,700 |
| 2016 | $3,688 | $185,800 | $78,200 | $107,600 |
| 2015 | $3,496 | $180,400 | $75,900 | $104,500 |
Source: Public Records
Map
Nearby Homes
- 3 Miller Ave
- 586 Granby Rd
- 200 East St
- 540 Granby Rd Unit 72A
- 540 Granby Rd Unit 109
- 540 Granby Rd Unit 62
- 540 Granby Rd Unit 2
- 2 Pine Grove Dr
- 73 Pine Grove Dr
- 5 Karen Dr
- 289 Morgan St
- 55 Pleasant St Unit 4
- 35 Yale St
- 42 East St
- 5 Country View Ln
- 34 Hildreth Ave
- 31 College View Heights
- 19 Hildreth Ave
- 62 Old Lyman Rd
- 0 Granby Rd