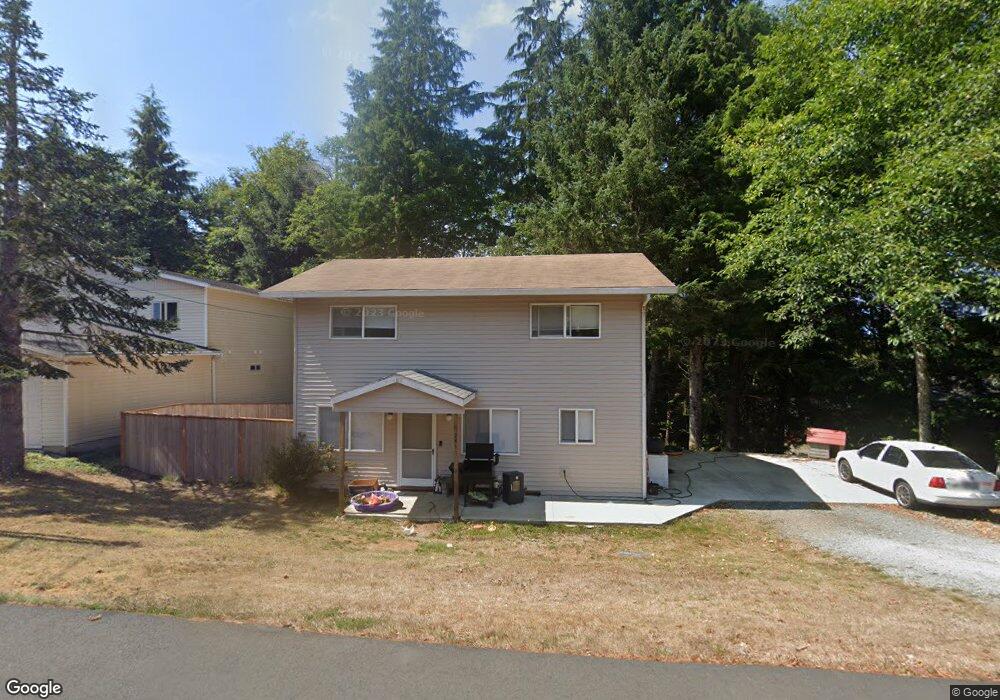
241 Quandrant St Rockaway Beach, OR 97136
Estimated Value: $364,000 - $419,000
3
Beds
2
Baths
1,440
Sq Ft
$269/Sq Ft
Est. Value
About This Home
This home is located at 241 Quandrant St, Rockaway Beach, OR 97136 and is currently estimated at $387,241, approximately $268 per square foot. 241 Quandrant St is a home located in Tillamook County with nearby schools including Garibaldi Elementary School, Nehalem Elementary School, and Neah-Kah-Nie Middle School.
Ownership History
Date
Name
Owned For
Owner Type
Purchase Details
Closed on
Oct 22, 2020
Sold by
Ofir Levy
Bought by
Hryciw Andrew and Robidoux Maria-Cristina
Current Estimated Value
Home Financials for this Owner
Home Financials are based on the most recent Mortgage that was taken out on this home.
Original Mortgage
$225,900
Outstanding Balance
$200,560
Interest Rate
2.8%
Mortgage Type
New Conventional
Estimated Equity
$186,681
Purchase Details
Closed on
Mar 22, 2017
Sold by
Pennymac Corp
Bought by
Levy Ofir
Home Financials for this Owner
Home Financials are based on the most recent Mortgage that was taken out on this home.
Original Mortgage
$155,200
Interest Rate
4.21%
Mortgage Type
New Conventional
Purchase Details
Closed on
Jun 21, 2016
Sold by
Hall Raymond A and Hall Maureen B
Bought by
Pennymac Holdings Llc
Purchase Details
Closed on
Nov 10, 2015
Sold by
Hall Raymond A and Hall Maureen B
Bought by
Pennymac Holdings Llc
Create a Home Valuation Report for This Property
The Home Valuation Report is an in-depth analysis detailing your home's value as well as a comparison with similar homes in the area
Home Values in the Area
Average Home Value in this Area
Purchase History
| Date | Buyer | Sale Price | Title Company |
|---|---|---|---|
| Hryciw Andrew | $251,000 | Ticor Title | |
| Levy Ofir | $194,000 | Servicelink | |
| Pennymac Corp | -- | None Available | |
| Pennymac Holdings Llc | $118,530 | None Available | |
| Pennymac Holdings Llc | $118,530 | None Available |
Source: Public Records
Mortgage History
| Date | Status | Borrower | Loan Amount |
|---|---|---|---|
| Open | Hryciw Andrew | $225,900 | |
| Previous Owner | Levy Ofir | $155,200 |
Source: Public Records
Tax History Compared to Growth
Tax History
| Year | Tax Paid | Tax Assessment Tax Assessment Total Assessment is a certain percentage of the fair market value that is determined by local assessors to be the total taxable value of land and additions on the property. | Land | Improvement |
|---|---|---|---|---|
| 2024 | $1,959 | $202,340 | $88,100 | $114,240 |
| 2023 | $1,951 | $196,450 | $85,530 | $110,920 |
| 2022 | $1,890 | $190,730 | $83,040 | $107,690 |
| 2021 | $1,832 | $185,180 | $80,620 | $104,560 |
| 2020 | $1,780 | $179,790 | $78,270 | $101,520 |
| 2019 | $1,731 | $174,560 | $75,990 | $98,570 |
| 2018 | $1,687 | $169,480 | $73,770 | $95,710 |
| 2017 | $1,640 | $164,550 | $71,620 | $92,930 |
| 2016 | $1,593 | $159,760 | $69,540 | $90,220 |
| 2015 | $1,567 | $155,110 | $67,510 | $87,600 |
| 2014 | $1,544 | $150,600 | $65,550 | $85,050 |
| 2013 | -- | $147,520 | $40,120 | $107,400 |
Source: Public Records
Map
Nearby Homes
- 302 S Quadrant St
- 215 S Neptune St
- 186 S Neptune St
- 0 St
- 101 S Quadrant St
- 126 N Ocean Ave
- 155 N Ocean Loop
- 240 S Harbor St
- 0 S Longview Loop Unit 23324548
- 0 S 2nd Ave
- 126 N Harbor St
- 367 S Longview Loop
- 461 Terrace Dr
- 0 N Marine St
- Lot 57 Pacific View Dr Unit TL3700
- 0 Marine Dr Unit 472180158
- 333 Pacific View Dr
- 0 N Ocean St Unit 472731104
- 0 N Ocean St Unit 478484794
- 241 S Quadrant St
- 253 S Quadrant St
- 234 S Palisades St
- 234 S Palisades St
- Tl#9407 S Quadrant St
- Tl#9407 S Quadrant St Unit 9407
- 234 S Palisade St
- VL Quadrant St Unit Rockaway Beach
- VL Quadrant St
- 0 Vl Quadrant St Unit 22-160
- 00 S Quadrant St
- 234 S Quadrant St
- 210 S Quadrant St
- 235 S Palisades St
- 1602 S 2nd Ave Unit 2N1032DC09401
- 1650 S 2nd Ave
- 208 S Quadrant St
- 0 S Quadrant St Unit 5-102274
- 0 S Quadrant St Unit 5-102281