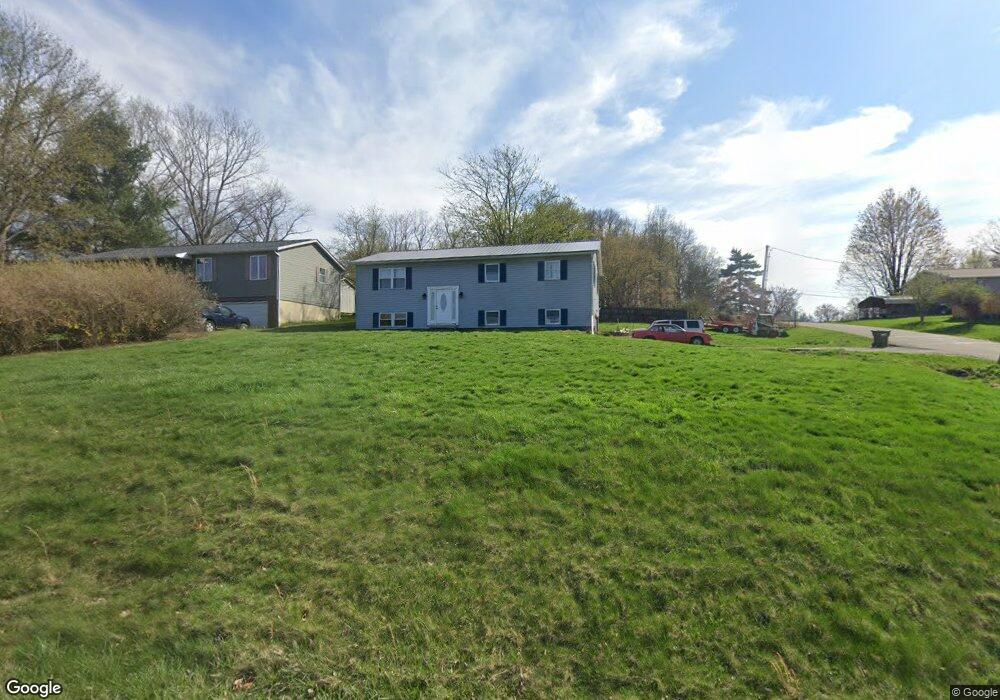
2410 Sherwood Hills Zanesville, OH 43701
Estimated Value: $225,000 - $301,000
3
Beds
3
Baths
1,724
Sq Ft
$152/Sq Ft
Est. Value
About This Home
This home is located at 2410 Sherwood Hills, Zanesville, OH 43701 and is currently estimated at $261,197, approximately $151 per square foot. 2410 Sherwood Hills is a home located in Muskingum County with nearby schools including Philo High School, Zanesville Community School, and Bishop Fenwick School.
Ownership History
Date
Name
Owned For
Owner Type
Purchase Details
Closed on
Oct 25, 2023
Sold by
Shepherd Clay G and Calendine Brittney K
Bought by
Shepherd Clay G
Current Estimated Value
Home Financials for this Owner
Home Financials are based on the most recent Mortgage that was taken out on this home.
Original Mortgage
$224,250
Outstanding Balance
$219,890
Interest Rate
7.18%
Mortgage Type
New Conventional
Estimated Equity
$41,307
Purchase Details
Closed on
Mar 23, 2022
Sold by
Dodson Phillip E
Bought by
Shepherd Clay G and Calendine Brittney K
Home Financials for this Owner
Home Financials are based on the most recent Mortgage that was taken out on this home.
Original Mortgage
$181,649
Interest Rate
4.16%
Mortgage Type
FHA
Purchase Details
Closed on
Jun 27, 2012
Sold by
Dodson Gregory A and Dodson Phillip E
Bought by
Dodson Phillip E
Create a Home Valuation Report for This Property
The Home Valuation Report is an in-depth analysis detailing your home's value as well as a comparison with similar homes in the area
Home Values in the Area
Average Home Value in this Area
Purchase History
| Date | Buyer | Sale Price | Title Company |
|---|---|---|---|
| Shepherd Clay G | $37,500 | None Listed On Document | |
| Shepherd Clay G | $37,500 | None Listed On Document | |
| Shepherd Clay G | -- | Hanks John C | |
| Shepherd Clay G | -- | None Listed On Document | |
| Dodson Phillip E | -- | Attorney |
Source: Public Records
Mortgage History
| Date | Status | Borrower | Loan Amount |
|---|---|---|---|
| Open | Shepherd Clay G | $224,250 | |
| Closed | Shepherd Clay G | $224,250 | |
| Previous Owner | Shepherd Clay G | $181,649 |
Source: Public Records
Tax History Compared to Growth
Tax History
| Year | Tax Paid | Tax Assessment Tax Assessment Total Assessment is a certain percentage of the fair market value that is determined by local assessors to be the total taxable value of land and additions on the property. | Land | Improvement |
|---|---|---|---|---|
| 2024 | $2,069 | $64,260 | $6,370 | $57,890 |
| 2023 | $1,615 | $47,600 | $4,865 | $42,735 |
| 2022 | $1,591 | $47,600 | $4,865 | $42,735 |
| 2021 | $1,566 | $47,600 | $4,865 | $42,735 |
| 2020 | $1,429 | $42,525 | $4,445 | $38,080 |
| 2019 | $1,426 | $42,525 | $4,445 | $38,080 |
| 2018 | $1,299 | $42,525 | $4,445 | $38,080 |
| 2017 | $1,195 | $33,495 | $4,445 | $29,050 |
| 2016 | $1,148 | $33,500 | $4,450 | $29,050 |
| 2015 | $1,180 | $33,500 | $4,450 | $29,050 |
| 2013 | $1,306 | $33,500 | $4,450 | $29,050 |
Source: Public Records
Map
Nearby Homes
- 2420 Sherwood Hills
- 2465 Clay Pike
- 440 Stardust Cir
- 0 East Pike Unit 5163133
- 2383 Chandlersville Rd
- 2425 S Pleasant Grove Rd
- 2850 Watson Way
- 240 Mockingbird Hill
- 0 Wayne Ridge Rd Unit 5141409
- 1636 Sharon Ave
- 330 Jordan Ave
- 1380 Wheeling Ave
- 1328 Pallas Ave
- 1365 Sharon (Rear) Ave
- 27 Cemetery Ave
- 1321 Wheeling Ave
- 1332 Sunrise Ave
- 1345 Eastman St
- 484 Haessler Ave
- 0 Greenwood Ave
- 2410 Sherwood Hills
- 2405 Clay Pike
- 2385 Clay Pike
- 2405 Sherwood Hills
- 385 Little John Dr
- 2430 Sherwood Hills
- 2425 Sherwood Hills
- Lot #36 Little John Dr
- 2375 Clay Pike
- 2440 Sherwood Hills
- 2400 Friar Tuck Rd
- 375 Little John Dr
- 2420 Friar Tuck Rd
- 0 Little John Dr
- 2435 Sherwood Hills
- 2400 Clay Pike
- 2365 Clay Pike
- 2430 Friar Tuck Rd
- 2440 Clay Pike
- 2455 Sherwood Hills