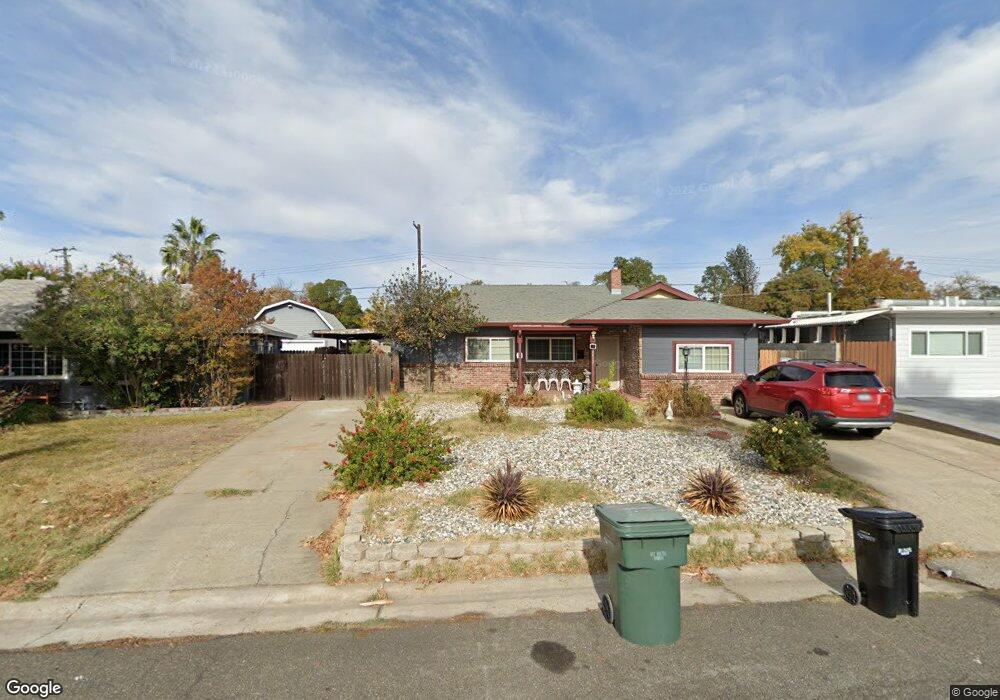
2413 Leslie Ln Sacramento, CA 95821
Bellview NeighborhoodEstimated Value: $316,000 - $413,000
2
Beds
1
Bath
1,747
Sq Ft
$219/Sq Ft
Est. Value
About This Home
This home is located at 2413 Leslie Ln, Sacramento, CA 95821 and is currently estimated at $383,080, approximately $219 per square foot. 2413 Leslie Ln is a home located in Sacramento County with nearby schools including Howe Avenue Elementary School, Encina Preparatory High School, and Aspire Alexander Twilight College Preparatory Academy.
Ownership History
Date
Name
Owned For
Owner Type
Purchase Details
Closed on
Oct 19, 2012
Sold by
Byrd Greg S
Bought by
Byrd Greg S
Current Estimated Value
Home Financials for this Owner
Home Financials are based on the most recent Mortgage that was taken out on this home.
Original Mortgage
$172,575
Interest Rate
3.5%
Mortgage Type
New Conventional
Purchase Details
Closed on
Aug 24, 2007
Sold by
Byrd Gregory S and Byrd Terri A
Bought by
Byrd Greg S
Home Financials for this Owner
Home Financials are based on the most recent Mortgage that was taken out on this home.
Original Mortgage
$180,000
Interest Rate
6.74%
Mortgage Type
New Conventional
Purchase Details
Closed on
Dec 20, 2002
Sold by
Byrd Gregory S and Byrd Terri Ann
Bought by
Byrd Gregory S and Byrd Terri A
Home Financials for this Owner
Home Financials are based on the most recent Mortgage that was taken out on this home.
Original Mortgage
$106,700
Interest Rate
5.86%
Create a Home Valuation Report for This Property
The Home Valuation Report is an in-depth analysis detailing your home's value as well as a comparison with similar homes in the area
Home Values in the Area
Average Home Value in this Area
Purchase History
| Date | Buyer | Sale Price | Title Company |
|---|---|---|---|
| Byrd Greg S | -- | Title Source | |
| Byrd Greg S | -- | Commonwealth Land Title | |
| Byrd Gregory S | -- | Alliance Title Company |
Source: Public Records
Mortgage History
| Date | Status | Borrower | Loan Amount |
|---|---|---|---|
| Closed | Byrd Greg S | $172,575 | |
| Closed | Byrd Greg S | $180,000 | |
| Closed | Byrd Gregory S | $106,700 |
Source: Public Records
Tax History Compared to Growth
Tax History
| Year | Tax Paid | Tax Assessment Tax Assessment Total Assessment is a certain percentage of the fair market value that is determined by local assessors to be the total taxable value of land and additions on the property. | Land | Improvement |
|---|---|---|---|---|
| 2025 | $1,880 | $153,838 | $56,279 | $97,559 |
| 2024 | $1,880 | $150,823 | $55,176 | $95,647 |
| 2023 | $1,832 | $147,867 | $54,095 | $93,772 |
| 2022 | $1,821 | $144,969 | $53,035 | $91,934 |
| 2021 | $1,790 | $142,128 | $51,996 | $90,132 |
| 2020 | $1,757 | $140,671 | $51,463 | $89,208 |
| 2019 | $1,721 | $137,913 | $50,454 | $87,459 |
| 2018 | $1,698 | $135,210 | $49,465 | $85,745 |
| 2017 | $1,683 | $132,560 | $48,496 | $84,064 |
| 2016 | $1,492 | $129,962 | $47,546 | $82,416 |
| 2015 | $1,465 | $128,011 | $46,832 | $81,179 |
| 2014 | $1,433 | $125,504 | $45,915 | $79,589 |
Source: Public Records
Map
Nearby Homes
- 2416 Wulff Ln
- 2433 Gwen Dr
- 2410 Post Oak Ln
- 2822 Sweet Way
- 2808 Sweet Way
- 2133 Cortez Ln
- 2931 Wright St
- 2108 Tevis Rd
- 2727 Lacy Ln
- 2265 Marconi Ave
- 2520 Carson Way
- 2730 Idlewood Ln
- 2550 Carson Way
- 2620 Darwin St
- 2113 Weldon Way
- 2155 Whippoorwill Ln
- 2513 Anna Way
- 2100 Bowling Green Dr
- 2012 El Camino Ave
- 2500 Ethan Way
- 2417 Leslie Ln
- 2409 Leslie Ln
- 2421 Leslie Ln
- 2405 Leslie Ln
- 2562 Charlotte Ln
- 2425 Leslie Ln
- 2404 Leslie Ln
- 2420 Leslie Ln
- 2606 Park Hills Dr
- 2590 Wright St
- 2401 Leslie Ln
- 2610 Park Hills Dr
- 2424 Leslie Ln
- 2632 Park Hills Dr
- 2558 Charlotte Ln
- 2620 Park Hills Dr
- 2600 Wright St
- 2559 Charlotte Ln
- 2429 Leslie Ln
- 2441 Wulff Ln