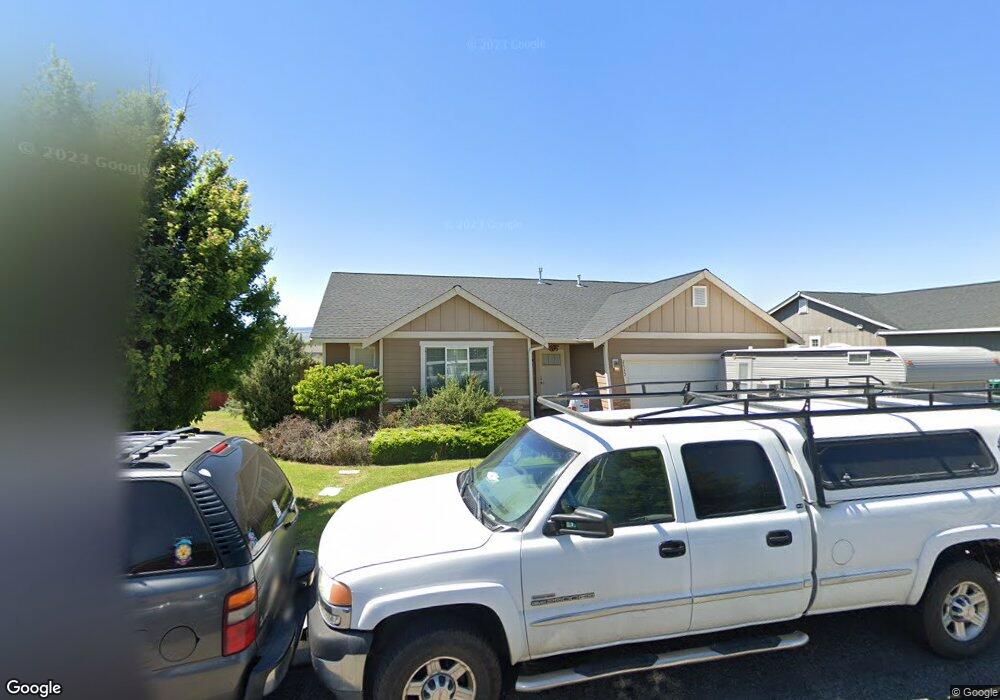
2413 N Columbia St Ellensburg, WA 98926
Estimated Value: $411,058 - $496,000
3
Beds
2
Baths
1,427
Sq Ft
$316/Sq Ft
Est. Value
About This Home
This home is located at 2413 N Columbia St, Ellensburg, WA 98926 and is currently estimated at $451,265, approximately $316 per square foot. 2413 N Columbia St is a home located in Kittitas County with nearby schools including Creative Kids Learning Center and Ellensburg Christian School.
Ownership History
Date
Name
Owned For
Owner Type
Purchase Details
Closed on
Jul 27, 2016
Sold by
Patry Andrew and Patry Katherine
Bought by
Patry Katherine E
Current Estimated Value
Purchase Details
Closed on
Dec 28, 2015
Sold by
Patry Andrew
Bought by
Patry Andrew and Patry Katherine
Purchase Details
Closed on
Aug 23, 2011
Sold by
Dire Michael A and Dire Catherine R
Bought by
Patry Andrew
Purchase Details
Closed on
Jun 24, 2008
Sold by
Pillar Development Llc
Bought by
Dire Michael A and Dire Catherine R
Home Financials for this Owner
Home Financials are based on the most recent Mortgage that was taken out on this home.
Original Mortgage
$197,999
Interest Rate
5.75%
Mortgage Type
Adjustable Rate Mortgage/ARM
Purchase Details
Closed on
Aug 27, 2007
Sold by
Stoney Creek Llc
Bought by
Pillar Development Llc
Home Financials for this Owner
Home Financials are based on the most recent Mortgage that was taken out on this home.
Original Mortgage
$178,400
Interest Rate
6.73%
Mortgage Type
Construction
Create a Home Valuation Report for This Property
The Home Valuation Report is an in-depth analysis detailing your home's value as well as a comparison with similar homes in the area
Home Values in the Area
Average Home Value in this Area
Purchase History
| Date | Buyer | Sale Price | Title Company |
|---|---|---|---|
| Patry Katherine E | -- | None Available | |
| Patry Andrew | -- | Amerititle | |
| Patry Andrew | $172,000 | Stewart Title | |
| Patry Andrew | -- | Amerititle | |
| Dire Michael A | $219,998 | Stewart Title | |
| Pillar Development Llc | $51,000 | Stwt Title |
Source: Public Records
Mortgage History
| Date | Status | Borrower | Loan Amount |
|---|---|---|---|
| Previous Owner | Dire Michael A | $197,999 | |
| Previous Owner | Pillar Development Llc | $178,400 |
Source: Public Records
Tax History Compared to Growth
Tax History
| Year | Tax Paid | Tax Assessment Tax Assessment Total Assessment is a certain percentage of the fair market value that is determined by local assessors to be the total taxable value of land and additions on the property. | Land | Improvement |
|---|---|---|---|---|
| 2025 | $160 | $366,760 | $120,760 | $246,000 |
| 2023 | $3,494 | $352,910 | $90,780 | $262,130 |
| 2022 | $3,303 | $294,490 | $70,590 | $223,900 |
| 2021 | $3,245 | $273,610 | $60,430 | $213,180 |
| 2019 | $2,689 | $219,310 | $45,320 | $173,990 |
| 2018 | $2,404 | $204,500 | $45,320 | $159,180 |
| 2017 | $2,349 | $168,710 | $35,000 | $133,710 |
| 2016 | $2,271 | $168,710 | $35,000 | $133,710 |
| 2015 | $2,159 | $168,710 | $35,000 | $133,710 |
| 2013 | -- | $168,710 | $35,000 | $133,710 |
Source: Public Records
Map
Nearby Homes
- 101 W Courtney Ct
- 2401 N Delphine St
- 508 W Bender Rd
- 2515 N Snowdrop St
- 2304 N Ellington St
- 2514 N Benjamin Ln
- 244 N Abbey Glen Ct
- 402 W Helena Ave
- 101 E Kristen Ave
- 2510 N Spar Ln
- 2109 N Parklane Ave
- 2209 N Spar Ln
- 400 E 24th Ave
- 300 E Country Side Ave
- 203 E Chason Ave
- 1904 N Parklane Ave
- 201 E Chinook Rd
- 201 E Chinook Rd Unit Lot 10
- 1811 Regal St
- 305 E Stanford Ave
- 2411 N Columbia St
- 2501 N Columbia St
- 210 W Maci Ct
- 2503 N Columbia St
- 208 W Maci Ct
- 211 W Maci Ct
- 211 W Greenfield Ave
- 209 W Maci Ct
- 209 W Greenfield Ave
- 2507 N Columbia St
- 206 W Maci Ct
- 210 W Hailey Ct
- 207 W Greenfield Ave
- 207 W Maci Ct
- 204 W Maci Ct
- 2509 N Columbia St
- 208 W Hailey Ct
- 201 W Maci Ct
- 205 W Maci Ct
- 206 W Hailey Ct