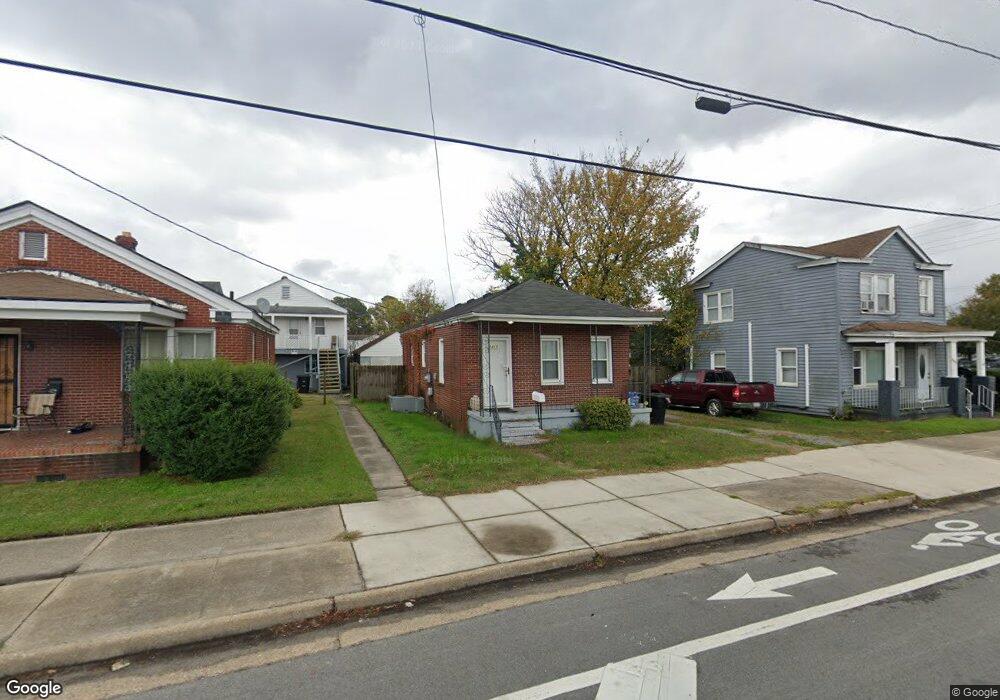
2415 Elm Ave Portsmouth, VA 23704
South Portsmouth NeighborhoodEstimated Value: $123,000 - $162,227
2
Beds
1
Bath
650
Sq Ft
$223/Sq Ft
Est. Value
About This Home
This home is located at 2415 Elm Ave, Portsmouth, VA 23704 and is currently estimated at $144,807, approximately $222 per square foot. 2415 Elm Ave is a home located in Portsmouth City with nearby schools including Brighton Elementary School, Manor High School, and St Mark Christian Academy.
Ownership History
Date
Name
Owned For
Owner Type
Purchase Details
Closed on
Oct 3, 2022
Sold by
Pack John M and Pack Laura A
Bought by
Bond Stetson
Current Estimated Value
Home Financials for this Owner
Home Financials are based on the most recent Mortgage that was taken out on this home.
Original Mortgage
$121,262
Outstanding Balance
$116,421
Interest Rate
5.89%
Mortgage Type
FHA
Estimated Equity
$28,386
Purchase Details
Closed on
Dec 2, 2013
Sold by
Phillips Terry C
Bought by
Pack John M
Create a Home Valuation Report for This Property
The Home Valuation Report is an in-depth analysis detailing your home's value as well as a comparison with similar homes in the area
Home Values in the Area
Average Home Value in this Area
Purchase History
| Date | Buyer | Sale Price | Title Company |
|---|---|---|---|
| Bond Stetson | $123,500 | -- | |
| Pack John M | $45,000 | -- |
Source: Public Records
Mortgage History
| Date | Status | Borrower | Loan Amount |
|---|---|---|---|
| Open | Bond Stetson | $121,262 |
Source: Public Records
Tax History Compared to Growth
Tax History
| Year | Tax Paid | Tax Assessment Tax Assessment Total Assessment is a certain percentage of the fair market value that is determined by local assessors to be the total taxable value of land and additions on the property. | Land | Improvement |
|---|---|---|---|---|
| 2025 | $1,881 | $140,140 | $54,690 | $85,450 |
| 2024 | $1,881 | $139,010 | $54,690 | $84,320 |
| 2023 | $1,639 | $131,140 | $54,690 | $76,450 |
| 2022 | $1,234 | $94,900 | $43,750 | $51,150 |
| 2021 | $1,064 | $81,820 | $30,670 | $51,150 |
| 2020 | $1,021 | $78,510 | $29,210 | $49,300 |
| 2019 | $1,009 | $77,590 | $29,210 | $48,380 |
| 2018 | $1,009 | $77,590 | $29,210 | $48,380 |
| 2017 | $979 | $75,270 | $29,210 | $46,060 |
| 2016 | $979 | $75,270 | $29,210 | $46,060 |
| 2015 | $978 | $75,270 | $29,210 | $46,060 |
| 2014 | $956 | $75,270 | $29,210 | $46,060 |
Source: Public Records
Map
Nearby Homes