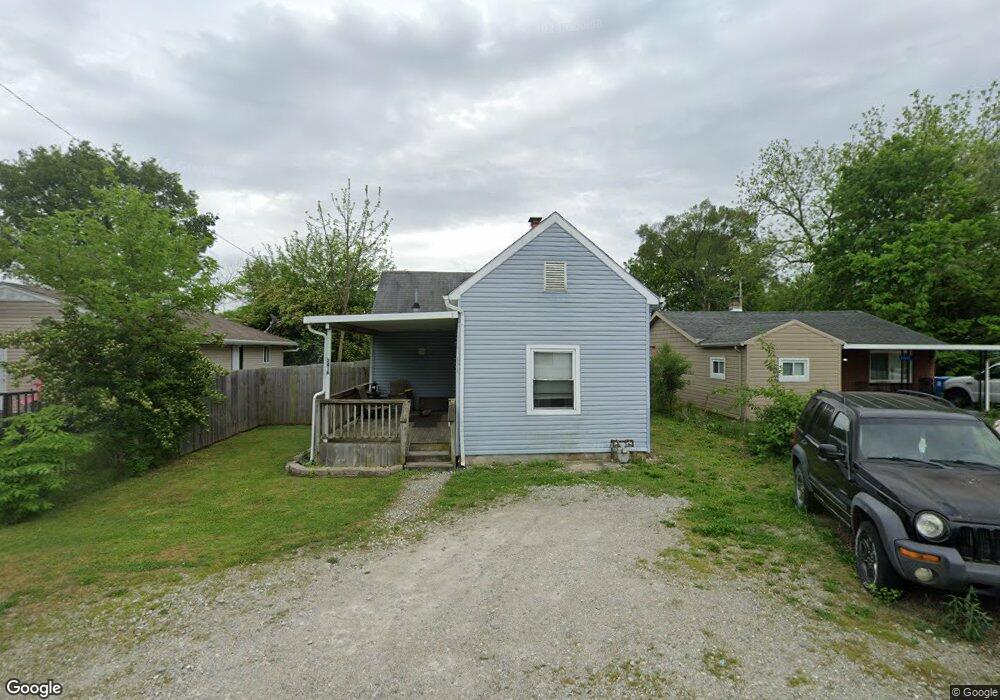
2416 Guernsey Dell Ave Dayton, OH 45404
Avondale NeighborhoodEstimated Value: $70,000 - $124,000
2
Beds
1
Bath
924
Sq Ft
$95/Sq Ft
Est. Value
About This Home
This home is located at 2416 Guernsey Dell Ave, Dayton, OH 45404 and is currently estimated at $88,032, approximately $95 per square foot. 2416 Guernsey Dell Ave is a home located in Montgomery County with nearby schools including Stebbins High School, Pathway School of Discovery, and Liberty High School.
Ownership History
Date
Name
Owned For
Owner Type
Purchase Details
Closed on
Aug 14, 2018
Sold by
Bilbrey Billy S and Bilbrey Angela J
Bought by
Eldridge Andrew J
Current Estimated Value
Purchase Details
Closed on
Mar 23, 2011
Sold by
Stonecrest Income & Opportunity Fund I L
Bought by
Bilbrey Billy S and Bilbrey Angela J
Purchase Details
Closed on
Jan 5, 2011
Sold by
Deutsche Bank National Trust Company
Bought by
Income & Opportunity Fund I Llc
Purchase Details
Closed on
Sep 30, 2010
Sold by
Fulton Richard L
Bought by
Deutsche Bank National Trust Company
Purchase Details
Closed on
Feb 17, 2005
Sold by
Owens Vernon Pierre
Bought by
Fulton Richard L
Purchase Details
Closed on
Dec 18, 2001
Sold by
Byrge Condy
Bought by
Owens Vernon Pierre
Purchase Details
Closed on
Oct 22, 2001
Sold by
Estate Of Ruby N Byrge
Bought by
Byrge Candy
Create a Home Valuation Report for This Property
The Home Valuation Report is an in-depth analysis detailing your home's value as well as a comparison with similar homes in the area
Home Values in the Area
Average Home Value in this Area
Purchase History
| Date | Buyer | Sale Price | Title Company |
|---|---|---|---|
| Eldridge Andrew J | $25,000 | Partners Land Title Agency | |
| Bilbrey Billy S | $11,900 | Attorney | |
| Income & Opportunity Fund I Llc | $1,000 | Attorney | |
| Deutsche Bank National Trust Company | $47,257 | None Available | |
| Fulton Richard L | $26,000 | None Available | |
| Owens Vernon Pierre | $62,500 | -- | |
| Byrge Candy | -- | -- |
Source: Public Records
Tax History Compared to Growth
Tax History
| Year | Tax Paid | Tax Assessment Tax Assessment Total Assessment is a certain percentage of the fair market value that is determined by local assessors to be the total taxable value of land and additions on the property. | Land | Improvement |
|---|---|---|---|---|
| 2024 | $838 | $16,590 | $4,490 | $12,100 |
| 2023 | $838 | $16,590 | $4,490 | $12,100 |
| 2022 | $893 | $13,270 | $3,590 | $9,680 |
| 2021 | $910 | $13,270 | $3,590 | $9,680 |
| 2020 | $910 | $13,270 | $3,590 | $9,680 |
| 2019 | $887 | $11,540 | $3,230 | $8,310 |
| 2018 | $889 | $11,540 | $3,230 | $8,310 |
| 2017 | $889 | $11,540 | $3,230 | $8,310 |
| 2016 | $834 | $10,770 | $3,590 | $7,180 |
| 2015 | $976 | $10,770 | $3,590 | $7,180 |
| 2014 | $976 | $10,770 | $3,590 | $7,180 |
| 2012 | -- | $10,780 | $3,590 | $7,190 |
Source: Public Records
Map
Nearby Homes
- 2460 Bushnell Ave
- 546 Wynora Ave
- 518 Tyron Ave
- -- Valley Pike
- - Valley Pike
- 2249 - Valley Pike
- 2301 Valley Pike
- - Prince Albert Blvd
- -- Prince Albert Blvd
- 2249 Prince Albert Blvd
- 2249 Valley Pike
- 2245 Valley Pike
- - Rondowa Ave
- -- Rondowa Ave
- 641 Prince Albert Blvd
- 29 Barcelona Ave
- 241 Community Dr
- 3586 Lane Garden Ct
- 1930 Brandt Pike
- 620 Homecrest Ave
- 2418 Guernsey Dell Ave
- 2412 Guernsey Dell Ave
- 2424 Guernsey Dell Ave
- 2428 Guernsey Dell Ave
- 2417 Bushnell Ave
- 2409 Bushnell Ave
- 2429 Bushnell Ave
- 2430 Guernsey Dell Ave
- 2417 Guernsey Dell Ave
- 2413 Guernsey Dell Ave
- 2425 Guernsey Dell Ave
- 2409 Guernsey Dell Ave
- 2436 Guernsey Dell Ave
- 2401 Bushnell Ave
- 2429 Guernsey Dell Ave
- 2407 Guernsey Dell Ave
- 2431 Guernsey Dell Ave
- 2435 Bushnell Ave
- 2442 Guernsey Dell Ave
- 2354 Guernsey Dell Ave