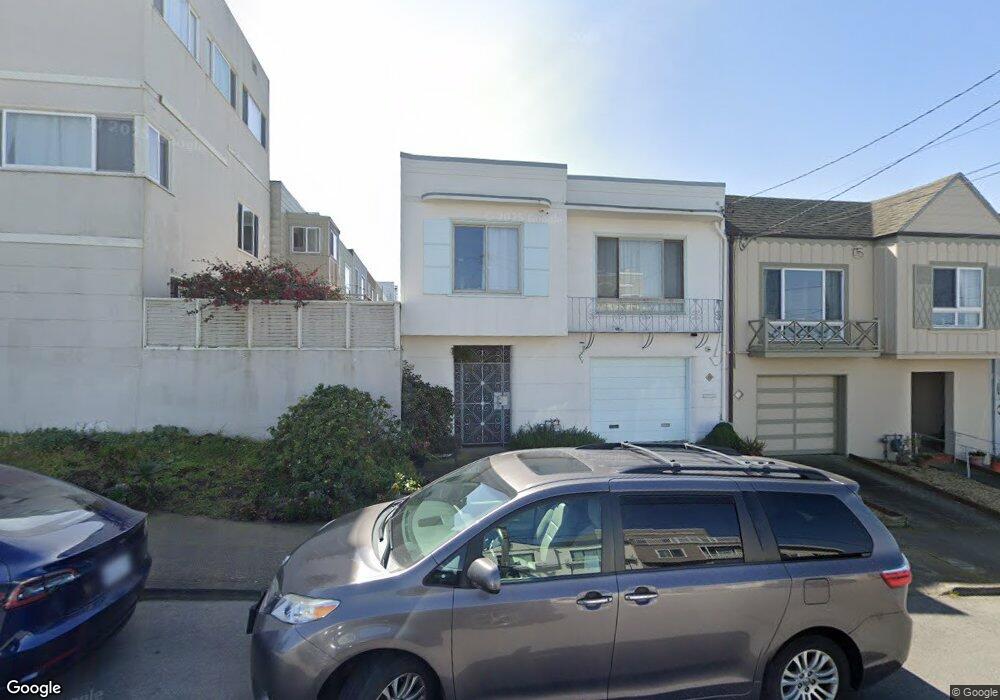
2419 Pacheco St San Francisco, CA 94116
Parkside NeighborhoodEstimated Value: $1,476,000 - $1,610,000
--
Bed
1
Bath
1,302
Sq Ft
$1,179/Sq Ft
Est. Value
About This Home
This home is located at 2419 Pacheco St, San Francisco, CA 94116 and is currently estimated at $1,535,117, approximately $1,179 per square foot. 2419 Pacheco St is a home located in San Francisco County with nearby schools including Stevenson (Robert Louis) Elementary School, Giannini (A.P.) Middle School, and Cornerstone Academy-Lawton Campus.
Ownership History
Date
Name
Owned For
Owner Type
Purchase Details
Closed on
Apr 7, 2006
Sold by
Lombardi James William and Lombardi Carmen R
Bought by
Janca John D and Han Buhee
Current Estimated Value
Home Financials for this Owner
Home Financials are based on the most recent Mortgage that was taken out on this home.
Original Mortgage
$565,000
Outstanding Balance
$313,516
Interest Rate
5.77%
Mortgage Type
Purchase Money Mortgage
Estimated Equity
$1,221,601
Create a Home Valuation Report for This Property
The Home Valuation Report is an in-depth analysis detailing your home's value as well as a comparison with similar homes in the area
Home Values in the Area
Average Home Value in this Area
Purchase History
| Date | Buyer | Sale Price | Title Company |
|---|---|---|---|
| Janca John D | $765,000 | First American Title Co |
Source: Public Records
Mortgage History
| Date | Status | Borrower | Loan Amount |
|---|---|---|---|
| Open | Janca John D | $565,000 |
Source: Public Records
Tax History Compared to Growth
Tax History
| Year | Tax Paid | Tax Assessment Tax Assessment Total Assessment is a certain percentage of the fair market value that is determined by local assessors to be the total taxable value of land and additions on the property. | Land | Improvement |
|---|---|---|---|---|
| 2025 | $13,010 | $1,066,814 | $627,253 | $418,166 |
| 2024 | $13,010 | $1,050,187 | $614,954 | $409,967 |
| 2023 | $12,849 | $1,033,010 | $602,897 | $401,929 |
| 2022 | $12,616 | $1,014,286 | $591,076 | $394,049 |
| 2021 | $12,372 | $992,948 | $579,487 | $413,461 |
| 2020 | $12,492 | $987,555 | $573,546 | $414,009 |
| 2019 | $11,919 | $955,979 | $562,300 | $393,679 |
| 2018 | $11,570 | $941,761 | $551,275 | $390,486 |
| 2017 | $11,139 | $923,746 | $540,466 | $383,280 |
| 2016 | $10,940 | $904,858 | $529,869 | $374,989 |
| 2015 | $10,806 | $891,593 | $521,910 | $369,683 |
| 2014 | $10,572 | $878,513 | $511,687 | $366,826 |
Source: Public Records
Map
Nearby Homes