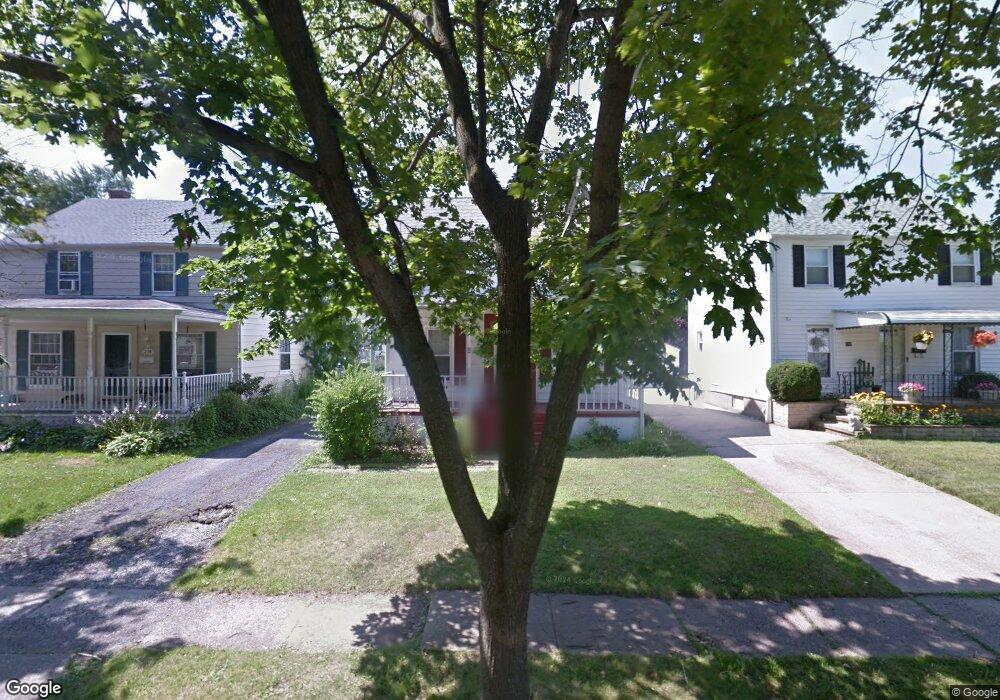
242 Johnson Ave Cuyahoga Falls, OH 44221
Mud Brook NeighborhoodEstimated Value: $225,089 - $248,000
3
Beds
2
Baths
1,500
Sq Ft
$159/Sq Ft
Est. Value
About This Home
This home is located at 242 Johnson Ave, Cuyahoga Falls, OH 44221 and is currently estimated at $238,022, approximately $158 per square foot. 242 Johnson Ave is a home located in Summit County with nearby schools including Lincoln Elementary School, Roberts Middle School, and Cuyahoga Falls High School.
Ownership History
Date
Name
Owned For
Owner Type
Purchase Details
Closed on
Sep 18, 2024
Sold by
Mollica Phillip A
Bought by
Mollica Phillip A and Mollica Kristina
Current Estimated Value
Home Financials for this Owner
Home Financials are based on the most recent Mortgage that was taken out on this home.
Original Mortgage
$166,870
Outstanding Balance
$165,001
Interest Rate
6.49%
Mortgage Type
FHA
Estimated Equity
$73,021
Purchase Details
Closed on
Oct 12, 2011
Sold by
Mollica Kathy A
Bought by
Mollica Phillip A
Purchase Details
Closed on
Oct 3, 2000
Sold by
Smith Patricia L
Bought by
Mollica Phillip A and Mollica Kathy A
Home Financials for this Owner
Home Financials are based on the most recent Mortgage that was taken out on this home.
Original Mortgage
$111,977
Interest Rate
7.99%
Mortgage Type
FHA
Create a Home Valuation Report for This Property
The Home Valuation Report is an in-depth analysis detailing your home's value as well as a comparison with similar homes in the area
Home Values in the Area
Average Home Value in this Area
Purchase History
| Date | Buyer | Sale Price | Title Company |
|---|---|---|---|
| Mollica Phillip A | -- | None Listed On Document | |
| Mollica Phillip A | -- | Attorney | |
| Mollica Phillip A | $112,900 | Endress/Lawyers Title |
Source: Public Records
Mortgage History
| Date | Status | Borrower | Loan Amount |
|---|---|---|---|
| Open | Mollica Phillip A | $166,870 | |
| Previous Owner | Mollica Phillip A | $111,977 |
Source: Public Records
Tax History Compared to Growth
Tax History
| Year | Tax Paid | Tax Assessment Tax Assessment Total Assessment is a certain percentage of the fair market value that is determined by local assessors to be the total taxable value of land and additions on the property. | Land | Improvement |
|---|---|---|---|---|
| 2025 | $3,526 | $65,318 | $10,728 | $54,590 |
| 2024 | $3,526 | $65,318 | $10,728 | $54,590 |
| 2023 | $3,526 | $65,318 | $10,728 | $54,590 |
| 2022 | $3,240 | $48,745 | $7,945 | $40,800 |
| 2021 | $3,240 | $48,745 | $7,945 | $40,800 |
| 2020 | $3,187 | $48,750 | $7,950 | $40,800 |
| 2019 | $3,127 | $43,560 | $7,730 | $35,830 |
| 2018 | $2,655 | $43,560 | $7,730 | $35,830 |
| 2017 | $2,620 | $43,560 | $7,730 | $35,830 |
| 2016 | $2,622 | $43,560 | $7,730 | $35,830 |
| 2015 | $2,620 | $43,560 | $7,730 | $35,830 |
| 2014 | $2,621 | $43,560 | $7,730 | $35,830 |
| 2013 | $3,070 | $43,100 | $7,730 | $35,370 |
Source: Public Records
Map
Nearby Homes
- 229 Hayes Ave
- 242 Monroe Ave
- 418 Hayes Ave
- 324 Madison Ave
- 3044 Bailey Rd
- 2873 Oakwood Dr
- 3166 7th St
- 223 Filmore Ave
- 2890 Bailey Rd
- 3119 Meier Place
- 2762 Elmwood St
- 2876 9th St
- 3106 Prior Dr
- 2736 Maplewood St
- 2886 Norwood St
- 2835 Bailey Rd
- 306 Hollywood Ave
- 921 Lincoln Ave
- 455 Marguerite Ave
- 419 Keenan Ave
- 248 Johnson Ave
- 254 Johnson Ave
- 230 Johnson Ave
- 260 Johnson Ave
- 224 Johnson Ave
- 235 Monroe Ave
- 241 Monroe Ave
- 229 Monroe Ave
- 223 Monroe Ave
- 253 Monroe Ave
- 235 Johnson Ave
- 241 Johnson Ave
- 229 Johnson Ave
- 212 Johnson Ave
- 247 Johnson Ave
- 306 Johnson Ave
- 217 Monroe Ave
- 223 Johnson Ave
- 253 Johnson Ave
- 217 Johnson Ave