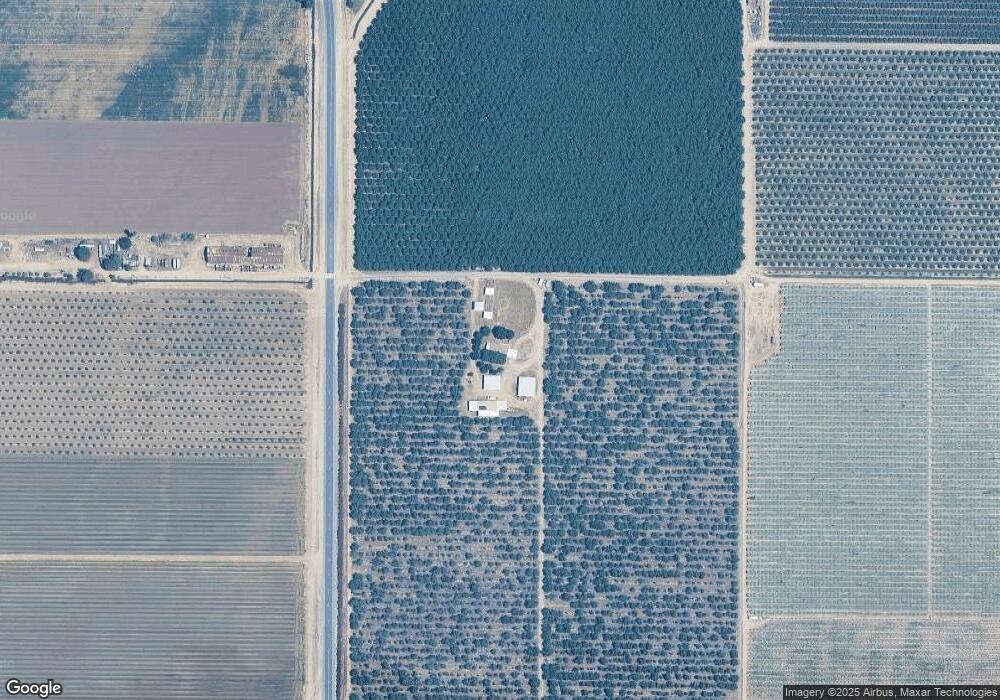
24246 Road 168 Tulare, CA 93274
Estimated Value: $784,026
--
Bed
--
Bath
--
Sq Ft
45
Acres
About This Home
This home is located at 24246 Road 168, Tulare, CA 93274 and is currently priced at $784,026. 24246 Road 168 is a home located in Tulare County with nearby schools including Outside Creek Elementary School.
Ownership History
Date
Name
Owned For
Owner Type
Purchase Details
Closed on
Mar 6, 2018
Sold by
Olson Eric and Olson Rebecca L
Bought by
Olson Eric and Olson Rebecca L
Current Estimated Value
Purchase Details
Closed on
Dec 26, 2014
Sold by
Hertzler Farms Llc
Bought by
Hertzler Farms
Home Financials for this Owner
Home Financials are based on the most recent Mortgage that was taken out on this home.
Original Mortgage
$435,000
Outstanding Balance
$333,559
Interest Rate
3.87%
Mortgage Type
Credit Line Revolving
Purchase Details
Closed on
Jun 6, 2003
Sold by
Cornucopia Farms Lp
Bought by
Olson Eric and Olson Rebecca L
Home Financials for this Owner
Home Financials are based on the most recent Mortgage that was taken out on this home.
Original Mortgage
$70,000
Interest Rate
5.13%
Mortgage Type
Seller Take Back
Purchase Details
Closed on
Jun 7, 2000
Sold by
Alves Brothers Inc
Bought by
Cornucopia Farms Lp
Purchase Details
Closed on
Jan 2, 1998
Sold by
Brothers Alves
Bought by
Alves Brothers Inc
Create a Home Valuation Report for This Property
The Home Valuation Report is an in-depth analysis detailing your home's value as well as a comparison with similar homes in the area
Home Values in the Area
Average Home Value in this Area
Purchase History
| Date | Buyer | Sale Price | Title Company |
|---|---|---|---|
| Olson Eric | -- | None Available | |
| Hertzler Farms | -- | Chicago Title Company | |
| Olson Eric | $265,000 | Cuesta Title | |
| Cornucopia Farms Lp | -- | -- | |
| Alves Brothers Inc | -- | Chicago Title Co |
Source: Public Records
Mortgage History
| Date | Status | Borrower | Loan Amount |
|---|---|---|---|
| Open | Hertzler Farms | $435,000 | |
| Previous Owner | Olson Eric | $70,000 |
Source: Public Records
Tax History Compared to Growth
Tax History
| Year | Tax Paid | Tax Assessment Tax Assessment Total Assessment is a certain percentage of the fair market value that is determined by local assessors to be the total taxable value of land and additions on the property. | Land | Improvement |
|---|---|---|---|---|
| 2023 | $5,857 | $485,114 | $99,457 | $385,657 |
| 2022 | $6,756 | $581,348 | $91,260 | $490,088 |
| 2021 | $7,507 | $652,478 | $81,501 | $570,977 |
| 2020 | $6,956 | $655,261 | $84,326 | $570,935 |
| 2019 | $6,928 | $649,176 | $300,679 | $348,497 |
| 2018 | $6,730 | $641,494 | $294,784 | $346,710 |
| 2017 | $6,709 | $630,508 | $289,004 | $341,504 |
| 2016 | $6,534 | $622,586 | $283,337 | $339,249 |
| 2015 | $5,649 | $531,252 | $79,263 | $451,989 |
| 2014 | $5,649 | $516,789 | $77,576 | $439,213 |
Source: Public Records
Map
Nearby Homes
- 22431 Road 180
- 22198 Road 180
- 19049 Avenue 242
- 14999 Avenue 260
- 0 Avenue 234
- 26349 Road 192
- 605 S Anderson B Rd
- 605 S Anderson B Dr
- 605 S Anderson Rd
- 19974 Avenue 260
- 651 S Cornucopia Rd
- 245 W Oakland St
- 528 S Camelia Ave
- 0 S Cornucopia Rd Unit 233072
- 0 S Cornucopia Rd Unit Lot52
- 0 S Cornucopia Rd Unit PI25249591
- 327 S Farmersville Blvd