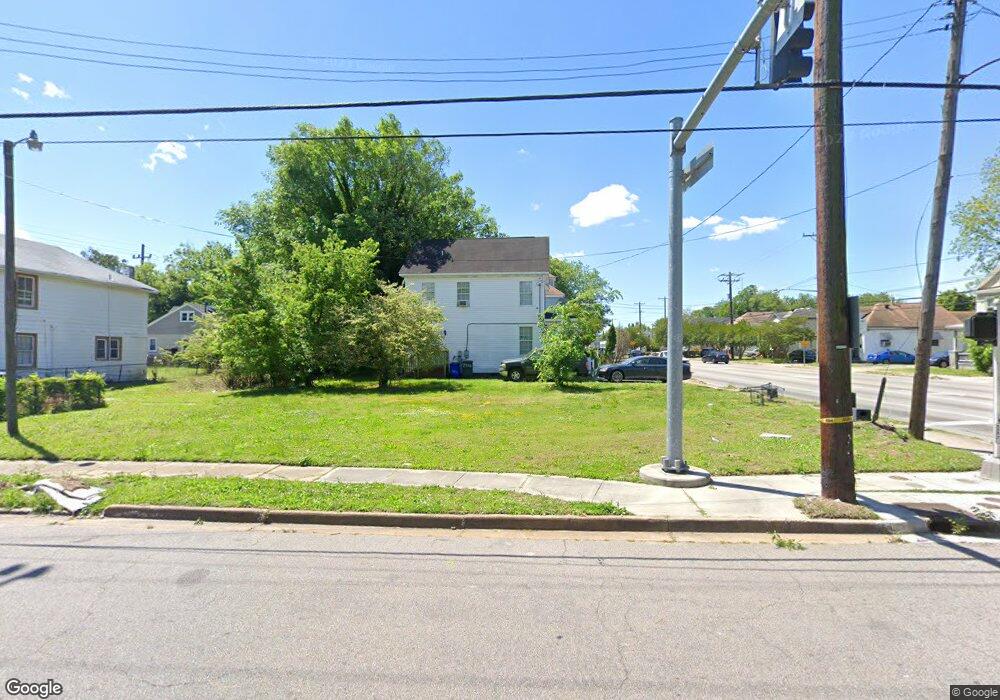
2426 Tidewater Dr Norfolk, VA 23504
Barraud Park NeighborhoodEstimated Value: $279,000 - $291,343
3
Beds
3
Baths
1,568
Sq Ft
$180/Sq Ft
Est. Value
About This Home
This home is located at 2426 Tidewater Dr, Norfolk, VA 23504 and is currently estimated at $282,836, approximately $180 per square foot. 2426 Tidewater Dr is a home located in Norfolk City with nearby schools including Jacox Elementary School, Ruffner Middle School, and Granby High School.
Ownership History
Date
Name
Owned For
Owner Type
Purchase Details
Closed on
Apr 29, 2010
Sold by
Faith Based Investments
Bought by
Davis Donta D
Current Estimated Value
Home Financials for this Owner
Home Financials are based on the most recent Mortgage that was taken out on this home.
Original Mortgage
$147,184
Outstanding Balance
$98,941
Interest Rate
5.11%
Mortgage Type
FHA
Estimated Equity
$183,895
Purchase Details
Closed on
Aug 25, 2009
Sold by
Fatherly Amos T and Fatherly Wendy L
Bought by
Faith Based Investment Corporation
Purchase Details
Closed on
Dec 20, 2006
Sold by
Gravely Sherray
Bought by
Fatherly Amos T and Fatherly Wendy
Home Financials for this Owner
Home Financials are based on the most recent Mortgage that was taken out on this home.
Original Mortgage
$110,160
Interest Rate
6.35%
Mortgage Type
Purchase Money Mortgage
Purchase Details
Closed on
Apr 30, 2002
Sold by
Johnson George
Bought by
Pettus George A
Create a Home Valuation Report for This Property
The Home Valuation Report is an in-depth analysis detailing your home's value as well as a comparison with similar homes in the area
Home Values in the Area
Average Home Value in this Area
Purchase History
| Date | Buyer | Sale Price | Title Company |
|---|---|---|---|
| Davis Donta D | $149,900 | Old Republic | |
| Faith Based Investment Corporation | -- | None Available | |
| Fatherly Amos T | $70,000 | -- | |
| Pettus George A | -- | -- |
Source: Public Records
Mortgage History
| Date | Status | Borrower | Loan Amount |
|---|---|---|---|
| Open | Davis Donta D | $147,184 | |
| Previous Owner | Fatherly Amos T | $110,160 |
Source: Public Records
Tax History Compared to Growth
Tax History
| Year | Tax Paid | Tax Assessment Tax Assessment Total Assessment is a certain percentage of the fair market value that is determined by local assessors to be the total taxable value of land and additions on the property. | Land | Improvement |
|---|---|---|---|---|
| 2025 | $3,323 | $265,800 | $66,000 | $199,800 |
| 2024 | $3,268 | $261,400 | $66,000 | $195,400 |
| 2023 | $3,191 | $255,300 | $60,000 | $195,300 |
| 2022 | $2,838 | $227,000 | $46,400 | $180,600 |
| 2021 | $2,119 | $169,500 | $31,000 | $138,500 |
| 2020 | $2,081 | $166,500 | $28,000 | $138,500 |
| 2019 | $2,081 | $166,500 | $28,000 | $138,500 |
| 2018 | $1,988 | $159,000 | $28,000 | $131,000 |
| 2017 | $1,780 | $154,800 | $28,000 | $126,800 |
| 2016 | $1,780 | $151,500 | $28,000 | $123,500 |
| 2015 | $1,742 | $151,500 | $28,000 | $123,500 |
| 2014 | $1,742 | $151,500 | $28,000 | $123,500 |
Source: Public Records
Map
Nearby Homes
- 1050 Vista St
- 2408 Masi St
- 2320 Ruffin St
- 2419 Ludlow St
- 2655 Barre St
- 1825 Tidewater Dr
- 2323 Courtney Ave
- 2641 Barre St
- 2645 Barre St
- 914 Summit Ave
- 910 Lindenwood Ave
- 2651 Barre St
- 1827 Carswell St
- 908 Lindenwood Ave
- 934 Pollard St
- 1815 Tidewater Dr
- 1814 Bracey St
- 2603 Middle Ave
- 1032 Anderson St
- 2418 Hanson Ave
- 2424 Tidewater Dr
- 2430 Tidewater Dr
- 1045 Lindenwood Ave
- 1031 Lindenwood Ave
- 1047 Lindenwood Ave
- 2422 Tidewater Dr
- 2425 Cottage Ave
- 2435 Cottage Ave
- 2416 Tidewater Dr
- 2414 Tidewater Dr
- 2502 Tidewater Dr
- 2429 Tidewater Dr
- 1044 Lindenwood Ave
- 2425 Tidewater Dr
- 2423 Tidewater Dr
- 2427 Tidewater Dr
- 2421 Tidewater Dr
- 1046 Lindenwood Ave
- 2419 Tidewater Dr
- LOT 7 Cottage Ave