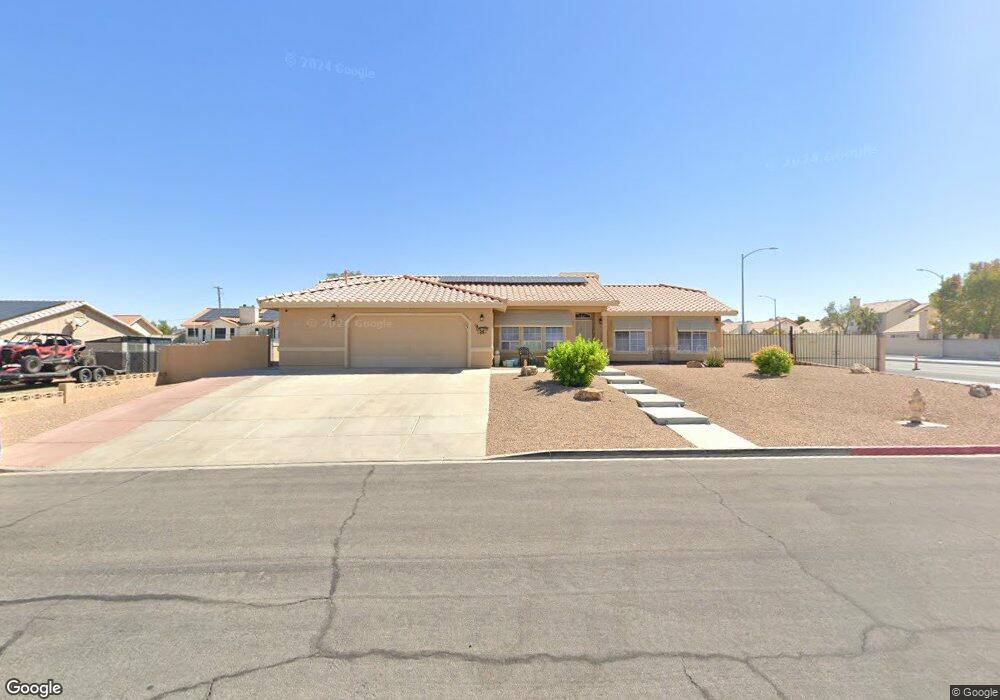
243 Belfast St Henderson, NV 89015
Foothills NeighborhoodEstimated Value: $600,742 - $722,000
4
Beds
2
Baths
2,079
Sq Ft
$309/Sq Ft
Est. Value
About This Home
This home is located at 243 Belfast St, Henderson, NV 89015 and is currently estimated at $642,686, approximately $309 per square foot. 243 Belfast St is a home located in Clark County with nearby schools including C T Sewell Elementary School, B Mahlon Brown Academy of International Studies, and Basic Academy of International Studies.
Ownership History
Date
Name
Owned For
Owner Type
Purchase Details
Closed on
Aug 14, 2025
Sold by
Jjb Family Trust and Barnette John W
Bought by
Jjb Family Trust and Barnette
Current Estimated Value
Purchase Details
Closed on
Oct 1, 2017
Sold by
Barnette John W and Barnette Julia C
Bought by
Barnette John W and Barnette Julia C
Purchase Details
Closed on
Jul 25, 2011
Sold by
Anko Llc
Bought by
Barnette John W and Barnette Julia C
Home Financials for this Owner
Home Financials are based on the most recent Mortgage that was taken out on this home.
Original Mortgage
$210,000
Interest Rate
4.46%
Mortgage Type
VA
Purchase Details
Closed on
Jun 13, 2011
Sold by
Warhop Robert E and Warhop Coreen Y
Bought by
Anko Llc
Home Financials for this Owner
Home Financials are based on the most recent Mortgage that was taken out on this home.
Original Mortgage
$210,000
Interest Rate
4.46%
Mortgage Type
VA
Create a Home Valuation Report for This Property
The Home Valuation Report is an in-depth analysis detailing your home's value as well as a comparison with similar homes in the area
Home Values in the Area
Average Home Value in this Area
Purchase History
| Date | Buyer | Sale Price | Title Company |
|---|---|---|---|
| Jjb Family Trust | -- | None Listed On Document | |
| Barnette John W | -- | None Available | |
| Barnette John W | $210,000 | Ticor Title Las Vegas | |
| Anko Llc | $118,401 | None Available |
Source: Public Records
Mortgage History
| Date | Status | Borrower | Loan Amount |
|---|---|---|---|
| Previous Owner | Barnette John W | $210,000 |
Source: Public Records
Tax History Compared to Growth
Tax History
| Year | Tax Paid | Tax Assessment Tax Assessment Total Assessment is a certain percentage of the fair market value that is determined by local assessors to be the total taxable value of land and additions on the property. | Land | Improvement |
|---|---|---|---|---|
| 2025 | $2,445 | $131,897 | $52,500 | $79,397 |
| 2024 | $2,374 | $131,897 | $52,500 | $79,397 |
| 2023 | $2,374 | $128,233 | $52,500 | $75,733 |
| 2022 | $2,305 | $115,088 | $45,500 | $69,588 |
| 2021 | $2,238 | $108,526 | $42,000 | $66,526 |
| 2020 | $2,170 | $107,951 | $42,000 | $65,951 |
| 2019 | $2,144 | $96,741 | $31,500 | $65,241 |
| 2018 | $1,966 | $81,534 | $21,000 | $60,534 |
| 2017 | $2,395 | $82,624 | $21,000 | $61,624 |
| 2016 | $1,841 | $82,690 | $21,000 | $61,690 |
| 2015 | $1,837 | $71,985 | $14,000 | $57,985 |
| 2014 | $1,783 | $62,811 | $14,000 | $48,811 |
Source: Public Records
Map
Nearby Homes
- 0 Cannes St
- 263 Prairie Rose St
- 831 Purple Sage Terrace
- 304 Belfast St
- 308 Belfast St
- 233 Mariposa Way
- 242 Fullerton Ave
- 216 Night Fall Terrace
- 253 Kirk Ave
- 914 Palo Verde Dr
- 915 N Major Ave
- 218 Kirk Ave
- 0 N Pueblo Blvd
- 900 Clipper Dr
- 259 Mojave Ln
- 944 River Mountain Dr
- 1009 Driftwood Ct
- 947 Clipper Dr
- 846 Fairview Dr
- 420 Hidden Brook Ct
- 247 Belfast St
- 244 Cannes St
- 248 Cannes St
- 812 Purple Sage Terrace
- 810 Purple Sage Terrace
- 814 Purple Sage Terrace
- 808 Purple Sage Terrace
- 251 Belfast St
- 816 Purple Sage Terrace
- 806 Purple Sage Terrace
- 818 Purple Sage Terrace
- 252 Cannes St
- 804 Purple Sage Terrace
- 820 Purple Sage Terrace
- 802 Purple Sage Terrace
- 247 Cannes St
- 269 Prairie Rose St
- 822 Purple Sage Terrace
- 255 Belfast St
- 268 Lilium St