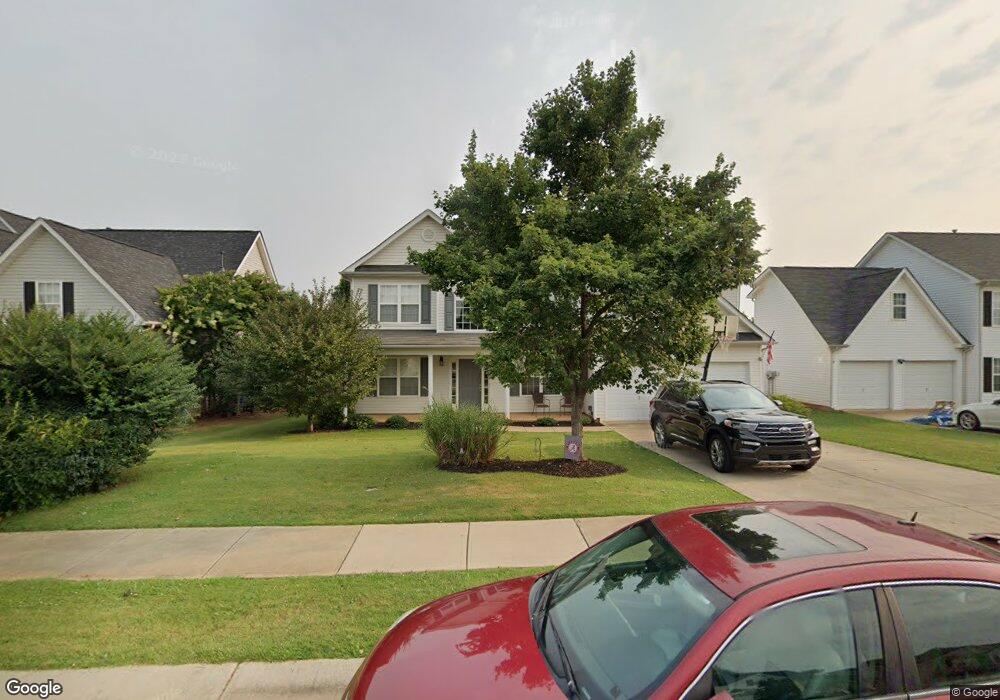
243 Madelia Place Mooresville, NC 28115
Estimated Value: $417,342 - $465,000
5
Beds
3
Baths
2,668
Sq Ft
$165/Sq Ft
Est. Value
About This Home
This home is located at 243 Madelia Place, Mooresville, NC 28115 and is currently estimated at $440,836, approximately $165 per square foot. 243 Madelia Place is a home located in Iredell County with nearby schools including Rocky River Elementary School, Mooresville Intermediate School, and Mooresville Middle.
Ownership History
Date
Name
Owned For
Owner Type
Purchase Details
Closed on
Nov 15, 2016
Sold by
Petrie Robert Michael and Petrie Connie Hajny
Bought by
Amh Nc Properties Lp
Current Estimated Value
Purchase Details
Closed on
Apr 10, 2006
Sold by
Crestwood Homes Llc
Bought by
Petrie Wendy and Petrie Robert M
Home Financials for this Owner
Home Financials are based on the most recent Mortgage that was taken out on this home.
Original Mortgage
$85,000
Interest Rate
6.23%
Mortgage Type
Fannie Mae Freddie Mac
Purchase Details
Closed on
Sep 13, 2005
Sold by
Mag Land Development Llc
Bought by
Crestwood Homes Llc
Home Financials for this Owner
Home Financials are based on the most recent Mortgage that was taken out on this home.
Original Mortgage
$1,066,500
Interest Rate
5.77%
Mortgage Type
Purchase Money Mortgage
Create a Home Valuation Report for This Property
The Home Valuation Report is an in-depth analysis detailing your home's value as well as a comparison with similar homes in the area
Home Values in the Area
Average Home Value in this Area
Purchase History
| Date | Buyer | Sale Price | Title Company |
|---|---|---|---|
| Amh Nc Properties Lp | $234,000 | None Available | |
| Petrie Wendy | $187,500 | None Available | |
| Crestwood Homes Llc | $1,066,500 | -- |
Source: Public Records
Mortgage History
| Date | Status | Borrower | Loan Amount |
|---|---|---|---|
| Previous Owner | Petrie Wendy | $85,000 | |
| Previous Owner | Crestwood Homes Llc | $1,066,500 |
Source: Public Records
Tax History Compared to Growth
Tax History
| Year | Tax Paid | Tax Assessment Tax Assessment Total Assessment is a certain percentage of the fair market value that is determined by local assessors to be the total taxable value of land and additions on the property. | Land | Improvement |
|---|---|---|---|---|
| 2024 | $4,788 | $397,340 | $60,000 | $337,340 |
| 2023 | $4,728 | $397,340 | $60,000 | $337,340 |
| 2022 | $3,376 | $245,390 | $40,000 | $205,390 |
| 2021 | $3,372 | $245,390 | $40,000 | $205,390 |
| 2020 | $3,372 | $245,390 | $40,000 | $205,390 |
| 2019 | $3,348 | $245,390 | $40,000 | $205,390 |
| 2018 | $2,879 | $209,470 | $32,000 | $177,470 |
| 2017 | $2,819 | $209,470 | $32,000 | $177,470 |
| 2016 | $2,819 | $209,470 | $32,000 | $177,470 |
| 2015 | $2,819 | $209,470 | $32,000 | $177,470 |
| 2014 | $2,515 | $192,250 | $32,000 | $160,250 |
Source: Public Records
Map
Nearby Homes
- 167 Gage Dr
- 171 Gage Dr
- 122 Karlstad Ln
- 321 Almora Loop
- 112 Saye Place
- 217 Almora Loop
- 128 Millen Dr
- 124 Millen Dr
- 422 Almora Loop
- 166 Glenn Allen Rd
- 224 Royalton Rd
- 104 Elba Dr
- 118 Nevis Ln
- 108 Elrosa Rd
- 156 Rusty Nail Dr
- 000 Rocky River Rd
- 265 Rocky River Rd
- 327 Johnson Dairy Rd
- Jordan Plan at Farms at Bellingham
- Jasmine Plan at Farms at Bellingham
- 239 Madelia Place
- 247 Madelia Place
- 288 Glenn Allen Rd
- 284 Glenn Allen Rd
- 251 Madelia Place
- 235 Madelia Place
- 292 Glenn Allen Rd
- 244 Madelia Place
- 240 Madelia Place
- 248 Madelia Place
- 296 Glennallen Rd
- 236 Madelia Place
- 296 Glenn Allen Rd
- 231 Madelia Place
- 255 Madelia Place
- 000 Main Place
- 252 Madelia Place
- 276 Glenn Allen Rd
- 232 Madelia Place
- 300 Glenn Allen Rd