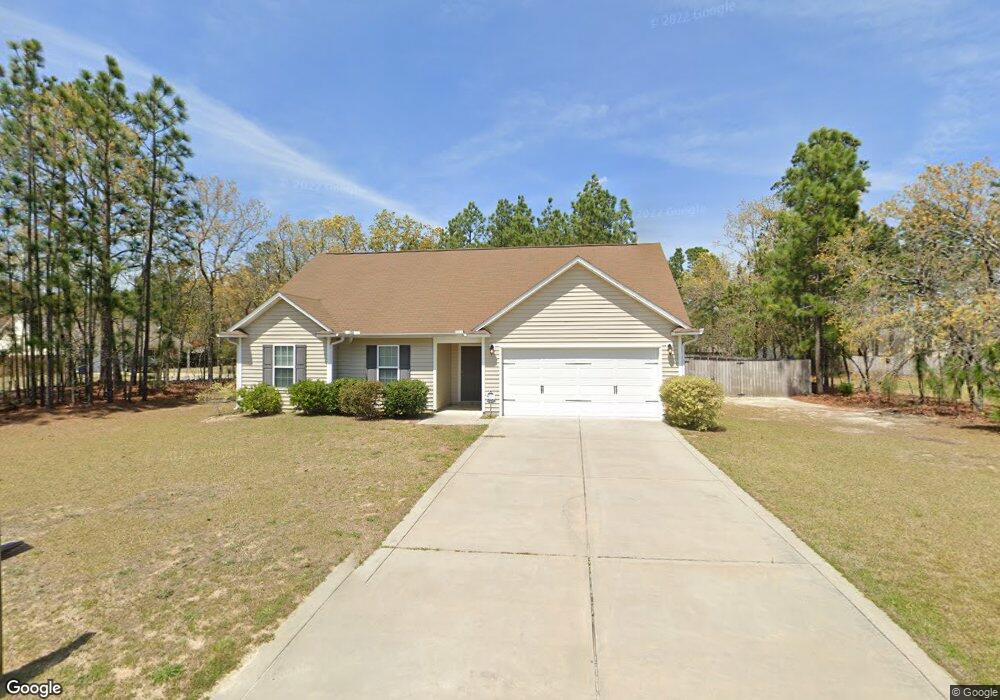
243 Maria Dr Raeford, NC 28376
Estimated Value: $220,000 - $262,000
3
Beds
2
Baths
1,265
Sq Ft
$191/Sq Ft
Est. Value
About This Home
This home is located at 243 Maria Dr, Raeford, NC 28376 and is currently estimated at $241,864, approximately $191 per square foot. 243 Maria Dr is a home located in Hoke County with nearby schools including Sandy Grove Elementary School, Sandy Grove Middle School, and Hoke County High.
Ownership History
Date
Name
Owned For
Owner Type
Purchase Details
Closed on
Nov 17, 2014
Sold by
Tri Star Buldind & Develpment
Bought by
Robinson Ii Barney J
Current Estimated Value
Home Financials for this Owner
Home Financials are based on the most recent Mortgage that was taken out on this home.
Original Mortgage
$138,673
Outstanding Balance
$106,935
Interest Rate
4.26%
Mortgage Type
New Conventional
Estimated Equity
$134,929
Purchase Details
Closed on
Aug 13, 2013
Sold by
M3 Investments Llc
Bought by
Tristar Building And Development Inc
Home Financials for this Owner
Home Financials are based on the most recent Mortgage that was taken out on this home.
Original Mortgage
$102,000
Interest Rate
4.29%
Mortgage Type
Future Advance Clause Open End Mortgage
Create a Home Valuation Report for This Property
The Home Valuation Report is an in-depth analysis detailing your home's value as well as a comparison with similar homes in the area
Home Values in the Area
Average Home Value in this Area
Purchase History
| Date | Buyer | Sale Price | Title Company |
|---|---|---|---|
| Robinson Ii Barney J | $136,000 | None Available | |
| Tristar Building And Development Inc | $31,000 | None Available |
Source: Public Records
Mortgage History
| Date | Status | Borrower | Loan Amount |
|---|---|---|---|
| Open | Robinson Ii Barney J | $138,673 | |
| Previous Owner | Tristar Building And Development Inc | $102,000 |
Source: Public Records
Tax History Compared to Growth
Tax History
| Year | Tax Paid | Tax Assessment Tax Assessment Total Assessment is a certain percentage of the fair market value that is determined by local assessors to be the total taxable value of land and additions on the property. | Land | Improvement |
|---|---|---|---|---|
| 2025 | $1,411 | $156,240 | $26,400 | $129,840 |
| 2024 | $1,411 | $156,240 | $26,400 | $129,840 |
| 2023 | $1,411 | $156,240 | $26,400 | $129,840 |
| 2022 | $1,386 | $156,240 | $26,400 | $129,840 |
| 2021 | $1,248 | $135,860 | $24,000 | $111,860 |
| 2020 | $1,269 | $135,860 | $24,000 | $111,860 |
| 2019 | $1,269 | $135,860 | $24,000 | $111,860 |
| 2018 | $1,269 | $135,860 | $24,000 | $111,860 |
| 2017 | $1,269 | $135,860 | $24,000 | $111,860 |
| 2016 | $1,246 | $135,860 | $24,000 | $111,860 |
| 2015 | $1,246 | $135,860 | $24,000 | $111,860 |
| 2014 | $1,224 | $135,860 | $24,000 | $111,860 |
| 2013 | -- | $30,000 | $30,000 | $0 |
Source: Public Records
Map
Nearby Homes