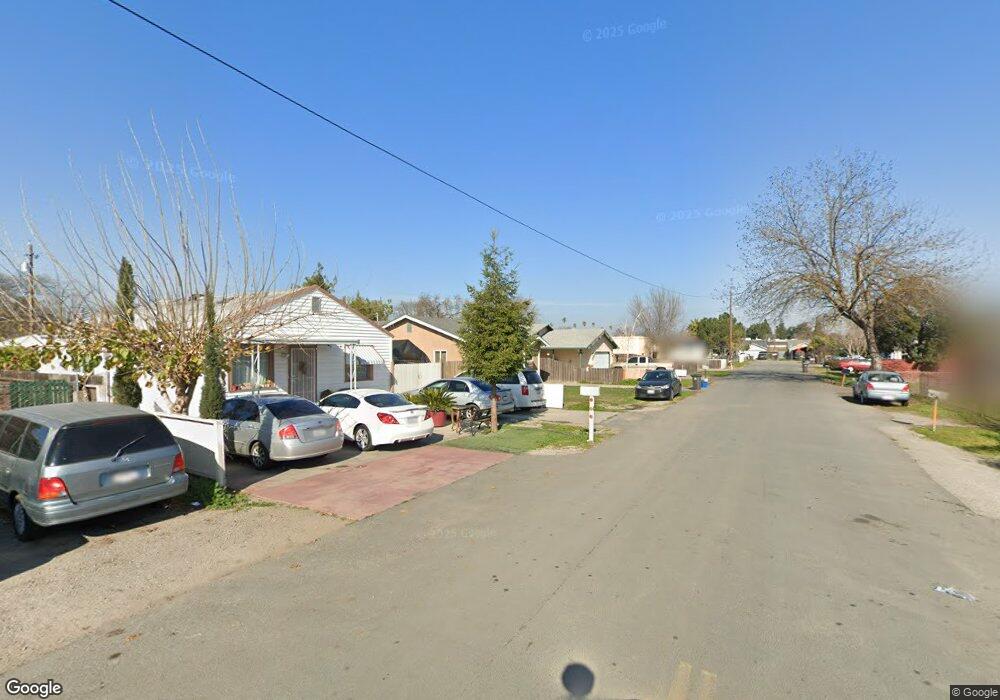
2435 N Totten Ave Stockton, CA 95205
Estimated Value: $268,000 - $431,000
4
Beds
2
Baths
1,310
Sq Ft
$270/Sq Ft
Est. Value
About This Home
This home is located at 2435 N Totten Ave, Stockton, CA 95205 and is currently estimated at $353,947, approximately $270 per square foot. 2435 N Totten Ave is a home located in San Joaquin County with nearby schools including August Elementary School, Harrison Elementary School, and Grunsky Elementary School.
Ownership History
Date
Name
Owned For
Owner Type
Purchase Details
Closed on
Apr 19, 2023
Sold by
Hussain Qamar and Hussain Sobia
Bought by
Qamar Hussain Revocable Trust
Current Estimated Value
Purchase Details
Closed on
Dec 13, 2018
Sold by
Cal Valley Investments
Bought by
Hussain Qmar and Khan Sobia
Purchase Details
Closed on
Nov 2, 2018
Sold by
Fever Steven R La and Fever Heidi R La
Bought by
Cal Valley Investments
Purchase Details
Closed on
Jun 7, 2006
Sold by
Lafever Steven R
Bought by
Lafever Steven R and Lafever Heidi R
Home Financials for this Owner
Home Financials are based on the most recent Mortgage that was taken out on this home.
Original Mortgage
$183,000
Interest Rate
6.56%
Mortgage Type
New Conventional
Purchase Details
Closed on
Feb 28, 2000
Sold by
Lafever M and Lafever Cotrs Z
Bought by
Lafever Steven R and Lafever Debora
Create a Home Valuation Report for This Property
The Home Valuation Report is an in-depth analysis detailing your home's value as well as a comparison with similar homes in the area
Home Values in the Area
Average Home Value in this Area
Purchase History
| Date | Buyer | Sale Price | Title Company |
|---|---|---|---|
| Qamar Hussain Revocable Trust | -- | None Listed On Document | |
| Hussain Qmar | $208,000 | Old Republic Title Company | |
| Cal Valley Investments | $155,000 | None Available | |
| Lafever Steven R | $233,000 | First American Title Co | |
| Lafever Steven R | -- | -- |
Source: Public Records
Mortgage History
| Date | Status | Borrower | Loan Amount |
|---|---|---|---|
| Previous Owner | Lafever Steven R | $183,000 |
Source: Public Records
Tax History Compared to Growth
Tax History
| Year | Tax Paid | Tax Assessment Tax Assessment Total Assessment is a certain percentage of the fair market value that is determined by local assessors to be the total taxable value of land and additions on the property. | Land | Improvement |
|---|---|---|---|---|
| 2025 | $3,846 | $232,023 | $55,774 | $176,249 |
| 2024 | $3,772 | $227,475 | $54,681 | $172,794 |
| 2023 | $3,654 | $223,015 | $53,609 | $169,406 |
| 2022 | $3,512 | $218,643 | $52,558 | $166,085 |
| 2021 | $2,670 | $214,357 | $51,528 | $162,829 |
| 2020 | $2,721 | $212,160 | $51,000 | $161,160 |
| 2019 | $2,450 | $142,489 | $18,223 | $124,266 |
| 2018 | $2,408 | $139,696 | $17,866 | $121,830 |
| 2017 | $2,286 | $136,958 | $17,516 | $119,442 |
| 2016 | $2,308 | $134,273 | $17,173 | $117,100 |
| 2014 | $2,187 | $129,667 | $16,583 | $113,084 |
Source: Public Records
Map
Nearby Homes
- 2819 Belle Ave
- 2525 Vail Ave
- 1825 N Filbert St
- 1551 Chronicle Ave
- 1550 N Filbert St
- 1561 N Filbert St
- 2484 Francis St
- 1413 N Newport Ave
- 2340 Sanguinetti Ln Unit 54
- 2612 E Harding Way
- 1368 N Newport Ave
- 2347 E Alpine Ave
- 2337 E Alpine Ave
- 2312 E Stadium Dr
- 1404 Williams St
- 2224 Big Oak Ct
- 1702 Sunnyside Ave
- 1751 Sunnyside Ave
- 1600 Sunnyside Ave
- 2327 E Acacia St
- 2427 N Totten Ave
- 2435 Totten Ave
- 2427 Totten Ave
- 2445 Totten Ave
- 2417 Totten Ave
- 2453 Totten Ave
- 2461 Totten Ave
- 2420 Totten Ave
- 2202 Myran Ave
- 2210 Myran Ave
- 2430 Totten Ave
- 2428 Totten Ave
- 2214 Myran Ave
- 2444 Totten Ave
- 2467 Totten Ave
- 2412 Totten Ave
- 2467 N Totten Ave
- 2450 Totten Ave
- 2224 Myran Ave
- 2460 Totten Ave