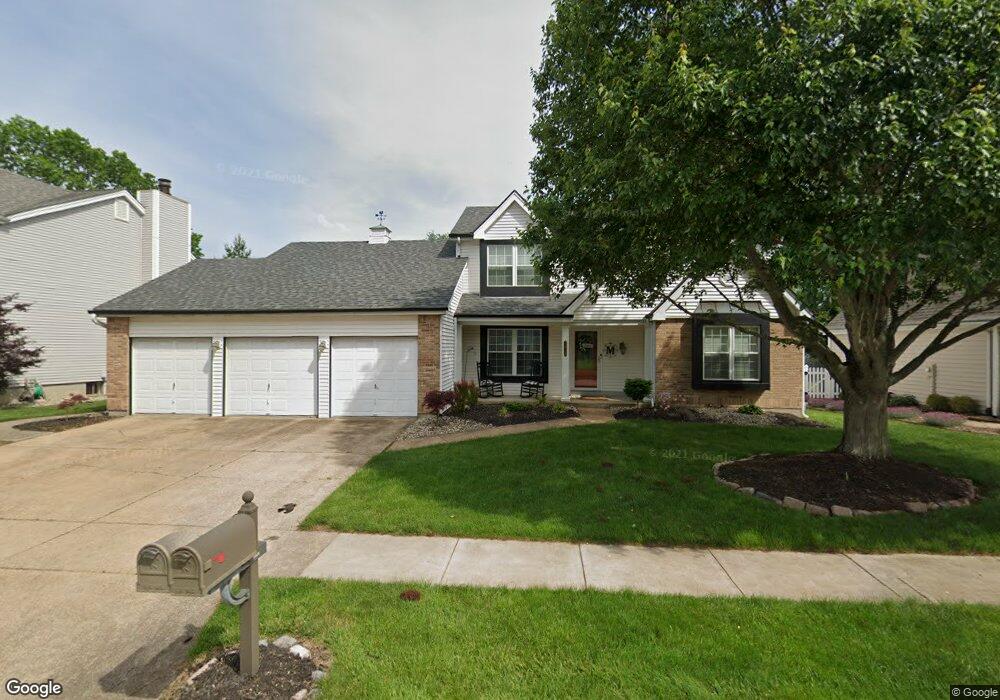
2436 Cripple Creek Dr Saint Louis, MO 63129
Estimated Value: $412,000 - $490,000
3
Beds
3
Baths
2,242
Sq Ft
$198/Sq Ft
Est. Value
About This Home
This home is located at 2436 Cripple Creek Dr, Saint Louis, MO 63129 and is currently estimated at $445,036, approximately $198 per square foot. 2436 Cripple Creek Dr is a home located in St. Louis County with nearby schools including Point Elementary School, Oakville Middle School, and Oakville Senior High School.
Ownership History
Date
Name
Owned For
Owner Type
Purchase Details
Closed on
Jan 10, 2004
Sold by
Mcclintock Daniel B
Bought by
Mcclintock Joan E
Current Estimated Value
Purchase Details
Closed on
Jul 27, 2000
Sold by
Mcclintock Joan E
Bought by
Murphy Bryan J and Murphy Nicole M
Home Financials for this Owner
Home Financials are based on the most recent Mortgage that was taken out on this home.
Original Mortgage
$180,000
Outstanding Balance
$64,045
Interest Rate
8.15%
Estimated Equity
$380,991
Purchase Details
Closed on
Jul 7, 2000
Sold by
Friess Steven Michael
Bought by
Mcclintock Daniel and Mcclintock Joan E
Home Financials for this Owner
Home Financials are based on the most recent Mortgage that was taken out on this home.
Original Mortgage
$180,000
Outstanding Balance
$64,045
Interest Rate
8.15%
Estimated Equity
$380,991
Create a Home Valuation Report for This Property
The Home Valuation Report is an in-depth analysis detailing your home's value as well as a comparison with similar homes in the area
Home Values in the Area
Average Home Value in this Area
Purchase History
| Date | Buyer | Sale Price | Title Company |
|---|---|---|---|
| Mcclintock Joan E | -- | -- | |
| Murphy Bryan J | $200,000 | First American Title | |
| Mcclintock Daniel | -- | First American Title |
Source: Public Records
Mortgage History
| Date | Status | Borrower | Loan Amount |
|---|---|---|---|
| Open | Murphy Bryan J | $180,000 |
Source: Public Records
Tax History Compared to Growth
Tax History
| Year | Tax Paid | Tax Assessment Tax Assessment Total Assessment is a certain percentage of the fair market value that is determined by local assessors to be the total taxable value of land and additions on the property. | Land | Improvement |
|---|---|---|---|---|
| 2025 | $4,946 | $78,660 | $21,660 | $57,000 |
| 2024 | $4,946 | $73,760 | $11,740 | $62,020 |
| 2023 | $4,883 | $73,760 | $11,740 | $62,020 |
| 2022 | $3,870 | $58,690 | $10,830 | $47,860 |
| 2021 | $3,745 | $58,690 | $10,830 | $47,860 |
| 2020 | $3,805 | $56,730 | $10,830 | $45,900 |
| 2019 | $3,794 | $56,730 | $10,830 | $45,900 |
| 2018 | $3,627 | $48,950 | $9,030 | $39,920 |
| 2017 | $3,622 | $48,950 | $9,030 | $39,920 |
| 2016 | $3,516 | $45,590 | $9,030 | $36,560 |
| 2015 | $3,228 | $45,590 | $9,030 | $36,560 |
| 2014 | $3,285 | $45,940 | $9,730 | $36,210 |
Source: Public Records
Map
Nearby Homes
- 6841 River Bow Ct
- 6834 Black Water Dr
- 6766 Dry Mill Ct
- 6568 Devonhurst Dr
- 2680 Cripple Creek Dr
- 2512 Janel Ct
- 315 Buford Landing
- 6708 Bear Creek Dr
- 2581 Christopher Oaks Ct
- 120 River Breeze Way
- 160 River Breeze Way
- 6221 Water Tower Place Dr
- 100 River Breeze Way
- 2771 Cliffwood Trail
- 2692 Queen Bee Ln
- 2995 Point Dr
- 6116 Arbor Green Dr
- 2503 River Winds Ct
- 156 Tori Pines Dr Unit 55
- 6840 Cottage Grove Ln Unit J
- 2442 Cripple Creek Dr
- 2430 Cripple Creek Dr
- 6573 Crescent View Dr
- 2448 Cripple Creek Dr
- 2424 Cripple Creek Dr
- 2435 Cripple Creek Dr
- 6565 Crescent View Dr
- 6577 Crescent View Dr
- 2441 Cripple Creek Dr
- 2454 Cripple Creek Dr
- 2418 Cripple Creek Dr
- 2423 Cripple Creek Dr
- 6561 Crescent View Dr
- 2447 Cripple Creek Dr
- 6715 Ringwood Ct
- 6581 Crescent View Dr
- 4 Jacqueline Knoll Ct
- 2453 Cripple Creek Dr
- 378 Greycliff Bluff Dr