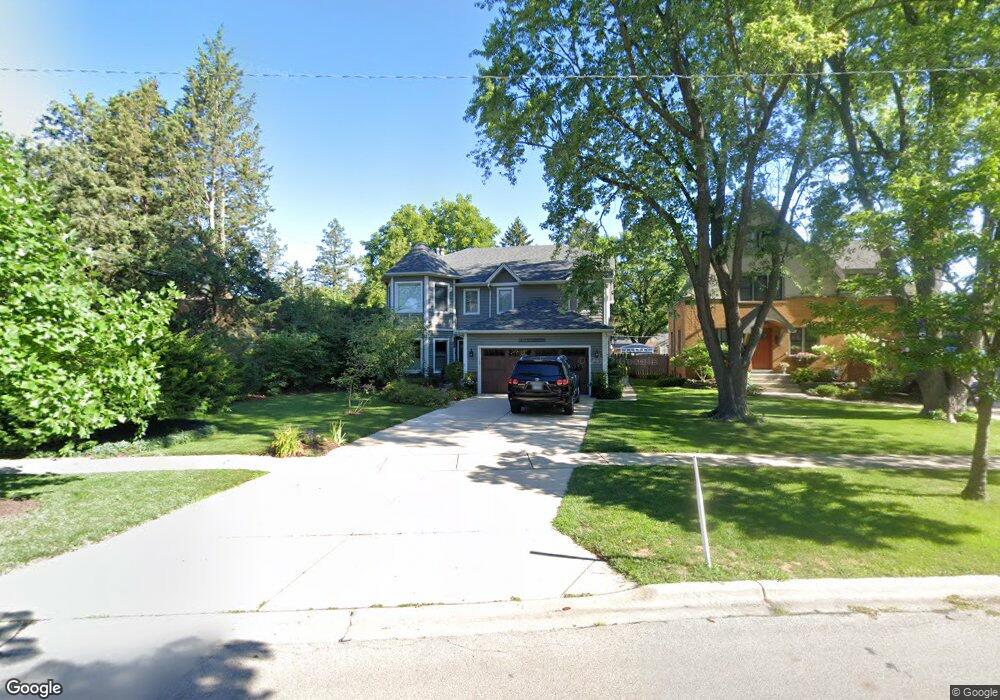
244 W Washington St Villa Park, IL 60181
Estimated Value: $540,023 - $807,000
--
Bed
--
Bath
3,010
Sq Ft
$214/Sq Ft
Est. Value
About This Home
This home is located at 244 W Washington St, Villa Park, IL 60181 and is currently estimated at $643,006, approximately $213 per square foot. 244 W Washington St is a home located in DuPage County with nearby schools including Ardmore Elementary School, Jackson Middle School, and Willowbrook High School.
Ownership History
Date
Name
Owned For
Owner Type
Purchase Details
Closed on
Aug 22, 2023
Sold by
Kiesel Fiona Anne and Miles Landon
Bought by
Miles Landon Kiesel An Fiona Kiesel Trust and Kiesel
Current Estimated Value
Purchase Details
Closed on
Mar 5, 2012
Sold by
Schultz James D
Bought by
Schultz Fiona A
Home Financials for this Owner
Home Financials are based on the most recent Mortgage that was taken out on this home.
Original Mortgage
$288,000
Interest Rate
3.9%
Mortgage Type
New Conventional
Purchase Details
Closed on
Oct 6, 2006
Sold by
Pomeroy Edward and Pomeroy Cynthia
Bought by
Schultz James D and Schultz Fiona A
Home Financials for this Owner
Home Financials are based on the most recent Mortgage that was taken out on this home.
Original Mortgage
$275,000
Interest Rate
6.49%
Mortgage Type
Purchase Money Mortgage
Create a Home Valuation Report for This Property
The Home Valuation Report is an in-depth analysis detailing your home's value as well as a comparison with similar homes in the area
Home Values in the Area
Average Home Value in this Area
Purchase History
| Date | Buyer | Sale Price | Title Company |
|---|---|---|---|
| Miles Landon Kiesel An Fiona Kiesel Trust | -- | None Listed On Document | |
| Schultz Fiona A | -- | Chicago Title Insurance Co | |
| Schultz James D | $475,000 | Ctic Dupage |
Source: Public Records
Mortgage History
| Date | Status | Borrower | Loan Amount |
|---|---|---|---|
| Previous Owner | Schultz Fiona A | $288,000 | |
| Previous Owner | Schultz James D | $275,000 |
Source: Public Records
Tax History Compared to Growth
Tax History
| Year | Tax Paid | Tax Assessment Tax Assessment Total Assessment is a certain percentage of the fair market value that is determined by local assessors to be the total taxable value of land and additions on the property. | Land | Improvement |
|---|---|---|---|---|
| 2024 | $11,583 | $161,247 | $24,926 | $136,321 |
| 2023 | $11,049 | $149,110 | $23,050 | $126,060 |
| 2022 | $10,677 | $143,320 | $22,150 | $121,170 |
| 2021 | $10,247 | $139,760 | $21,600 | $118,160 |
| 2020 | $10,008 | $136,700 | $21,130 | $115,570 |
| 2019 | $9,352 | $129,970 | $20,090 | $109,880 |
| 2018 | $9,302 | $121,810 | $18,830 | $102,980 |
| 2017 | $9,088 | $116,070 | $17,940 | $98,130 |
| 2016 | $8,843 | $109,340 | $16,900 | $92,440 |
| 2015 | $8,732 | $101,860 | $15,740 | $86,120 |
| 2014 | $10,080 | $117,090 | $31,270 | $85,820 |
| 2013 | $9,603 | $118,740 | $31,710 | $87,030 |
Source: Public Records
Map
Nearby Homes
- 835 S Wisconsin Ave
- 1041 E Division St
- 5 E Washington St
- 326 W Adams St
- 928 S Michigan Ave
- 194 Washington St
- 1150 E Jackson St Unit 1A
- 602 Arthur Dr
- 415 S Highland Ave
- 1 S 215 Stratford Ln
- 613 S Summit Ave
- 604 S Grant Ave
- 616 S Ahrens Ave
- 510 S Chase Ave
- 208 S Highland Ave
- 849 S School St
- 114 E Kenilworth Ave
- 118 S Highland Ave
- 316 E Highland Ave
- 125 S Chase Ave
- 302 W Washington St
- 240 W Washington St
- 530 S Michigan Ave
- 539 S Wisconsin Ave
- 529 S Wisconsin Ave
- 526 S Michigan Ave
- 533 S Wisconsin Ave
- 543 S Wisconsin Ave
- 235 W Washington St
- 525 S Wisconsin Ave
- 522 S Michigan Ave
- 610 S Michigan Ave
- 311 W Washington St
- 518 S Michigan Ave
- 521 S Wisconsin Ave
- 519 S Wisconsin Ave
- 593 S Wisconsin Ave
- 609 S Wisconsin Ave
- 614 S Michigan Ave
- 539 S Michigan Ave