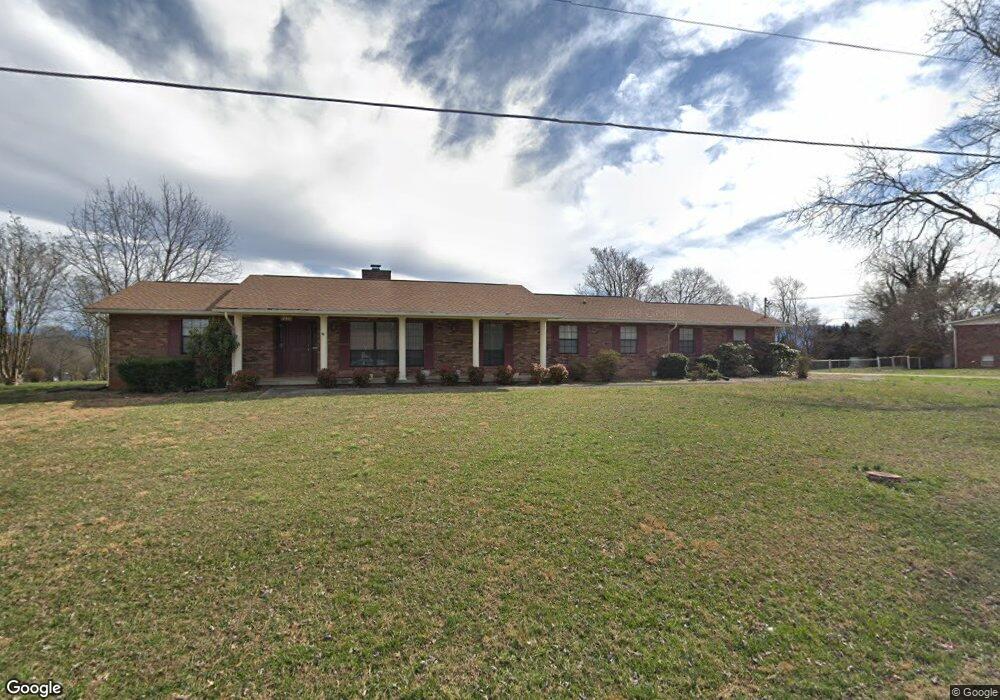
245 Cherokee Trail Seymour, TN 37865
Estimated Value: $378,833 - $387,000
3
Beds
2
Baths
2,161
Sq Ft
$177/Sq Ft
Est. Value
About This Home
This home is located at 245 Cherokee Trail, Seymour, TN 37865 and is currently estimated at $382,917, approximately $177 per square foot. 245 Cherokee Trail is a home located in Sevier County with nearby schools including Northview Elementary School, Catons Chapel Elementary School, and Jones Cove Elementary School.
Ownership History
Date
Name
Owned For
Owner Type
Purchase Details
Closed on
Aug 26, 2021
Sold by
Allmon Betty
Bought by
Allmon Betty and Orozco Elizabeth Ann
Current Estimated Value
Purchase Details
Closed on
Nov 4, 2019
Sold by
Loobey Kelly Kathrine and Estate Of John Joseph Stegmeye
Bought by
Allmon Betty
Purchase Details
Closed on
Jun 30, 2009
Sold by
Ward Charles D
Bought by
Stegmeyer John J
Purchase Details
Closed on
Apr 2, 2009
Sold by
Lasalle Bank National Asso
Bought by
Ward Charles D
Purchase Details
Closed on
Feb 20, 2009
Sold by
Danzl Sharon
Bought by
Lasalle Bank National Associat
Purchase Details
Closed on
Nov 2, 2004
Sold by
Mcpherson Mildred T
Bought by
Danzl Sharon
Home Financials for this Owner
Home Financials are based on the most recent Mortgage that was taken out on this home.
Original Mortgage
$163,000
Interest Rate
9.65%
Purchase Details
Closed on
Sep 25, 2001
Sold by
Downs John T Exec
Bought by
Downs John T
Create a Home Valuation Report for This Property
The Home Valuation Report is an in-depth analysis detailing your home's value as well as a comparison with similar homes in the area
Home Values in the Area
Average Home Value in this Area
Purchase History
| Date | Buyer | Sale Price | Title Company |
|---|---|---|---|
| Allmon Betty | -- | None Available | |
| Allmon Betty | $200,000 | None Available | |
| Stegmeyer John J | $140,000 | -- | |
| Ward Charles D | $129,900 | -- | |
| Lasalle Bank National Associat | $114,767 | -- | |
| Danzl Sharon | $163,000 | -- | |
| Downs John T | -- | -- |
Source: Public Records
Mortgage History
| Date | Status | Borrower | Loan Amount |
|---|---|---|---|
| Previous Owner | Downs John T | $163,000 |
Source: Public Records
Tax History Compared to Growth
Tax History
| Year | Tax Paid | Tax Assessment Tax Assessment Total Assessment is a certain percentage of the fair market value that is determined by local assessors to be the total taxable value of land and additions on the property. | Land | Improvement |
|---|---|---|---|---|
| 2025 | $811 | $54,800 | $7,575 | $47,225 |
| 2024 | $811 | $54,800 | $7,575 | $47,225 |
| 2023 | $811 | $54,800 | $0 | $0 |
| 2022 | $811 | $54,800 | $7,575 | $47,225 |
| 2021 | $811 | $54,800 | $7,575 | $47,225 |
| 2020 | $808 | $54,800 | $7,575 | $47,225 |
| 2019 | $808 | $43,425 | $8,675 | $34,750 |
| 2018 | $808 | $43,425 | $8,675 | $34,750 |
| 2017 | $808 | $43,425 | $8,675 | $34,750 |
| 2016 | $808 | $43,425 | $8,675 | $34,750 |
| 2015 | -- | $43,450 | $0 | $0 |
| 2014 | $708 | $43,457 | $0 | $0 |
Source: Public Records
Map
Nearby Homes
- 0 Cherokee
- 294 Cherokee Trail
- 406 Iroquois Ln
- 225 Wahoo Ct
- 105 Latonia Dr
- 961 Calico Ln
- 951 Calico Ln
- 326 Joshua Landing Ct
- 313 Hatcher Rd
- 315 Hatcher Rd
- 317 Hatcher Rd
- 914 Calico Ln
- 309 Boyds Creek Hwy
- Cabral Plan at Highland View
- Edmon Plan at Highland View
- Manning Plan at Highland View
- Elston Plan at Highland View
- Sullivan Plan at Highland View
- 926 Calico Ln
- 812 Fountain View Way
- 249 Cherokee Trail
- 246 Cherokee Trail
- 243 Cherokee Trail
- 250 Cherokee Trail
- 251 Cherokee Trail
- 240 Cherokee Trail
- 252 Cherokee Trail
- 254 Cherokee Trail
- 255 Cherokee Trail
- 239 Cherokee Trail
- 236 Cherokee Trail
- 270 Cherokee Trail
- 275 Cherokee Trail
- 237 Cherokee Trail
- 256 Cherokee Trail
- 257 Cherokee Trail
- 350 Sky Valley Cir
- 264 Cherokee Trail
- 133 Latonia Dr
- 284 Cherokee Trail