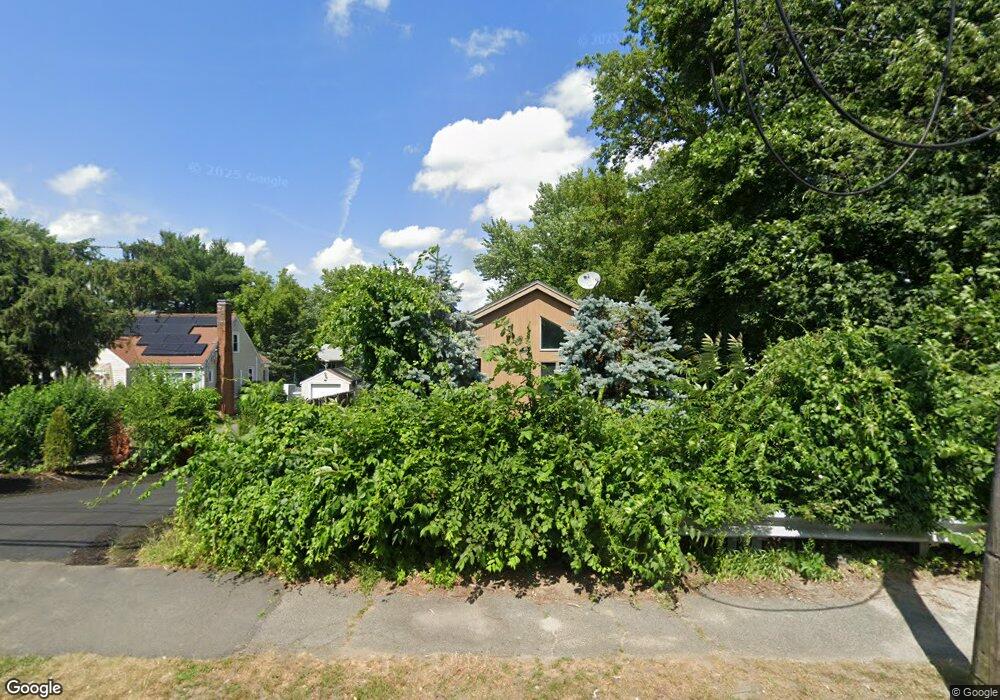
245 Essex St Saugus, MA 01906
Downtown Saugus NeighborhoodEstimated Value: $538,000 - $658,000
3
Beds
1
Bath
1,336
Sq Ft
$448/Sq Ft
Est. Value
About This Home
This home is located at 245 Essex St, Saugus, MA 01906 and is currently estimated at $599,072, approximately $448 per square foot. 245 Essex St is a home located in Essex County with nearby schools including Saugus High School, Pioneer Charter School Of Science II, and Melrose Montessori School.
Ownership History
Date
Name
Owned For
Owner Type
Purchase Details
Closed on
Jun 24, 2025
Sold by
Scaduto Jason
Bought by
Vista 21 Llc
Current Estimated Value
Purchase Details
Closed on
May 1, 2025
Sold by
Hayes Raymond M Est and Hayes
Bought by
Scaduto Jason
Purchase Details
Closed on
Mar 5, 1990
Sold by
Hayes Ruth C
Bought by
Hayes Raymond
Create a Home Valuation Report for This Property
The Home Valuation Report is an in-depth analysis detailing your home's value as well as a comparison with similar homes in the area
Home Values in the Area
Average Home Value in this Area
Purchase History
| Date | Buyer | Sale Price | Title Company |
|---|---|---|---|
| Vista 21 Llc | -- | None Available | |
| Vista 21 Llc | -- | None Available | |
| Vista 21 Llc | -- | None Available | |
| Scaduto Jason | $530,000 | None Available | |
| Scaduto Jason | $530,000 | None Available | |
| Scaduto Jason | $530,000 | None Available | |
| Hayes Raymond | $25,000 | -- | |
| Hayes Raymond | $25,000 | -- |
Source: Public Records
Tax History Compared to Growth
Tax History
| Year | Tax Paid | Tax Assessment Tax Assessment Total Assessment is a certain percentage of the fair market value that is determined by local assessors to be the total taxable value of land and additions on the property. | Land | Improvement |
|---|---|---|---|---|
| 2025 | $5,828 | $545,700 | $253,300 | $292,400 |
| 2024 | $5,500 | $516,400 | $230,300 | $286,100 |
| 2023 | $5,436 | $482,800 | $207,200 | $275,600 |
| 2022 | $5,262 | $438,100 | $189,600 | $248,500 |
| 2021 | $5,462 | $442,600 | $194,100 | $248,500 |
| 2020 | $5,331 | $447,200 | $203,400 | $243,800 |
| 2019 | $5,091 | $418,000 | $183,600 | $234,400 |
| 2018 | $4,674 | $403,600 | $178,600 | $225,000 |
| 2017 | $4,216 | $349,900 | $166,700 | $183,200 |
| 2016 | $4,398 | $360,500 | $158,300 | $202,200 |
| 2015 | $4,128 | $343,400 | $150,800 | $192,600 |
| 2014 | $3,417 | $294,300 | $128,200 | $166,100 |
Source: Public Records
Map
Nearby Homes