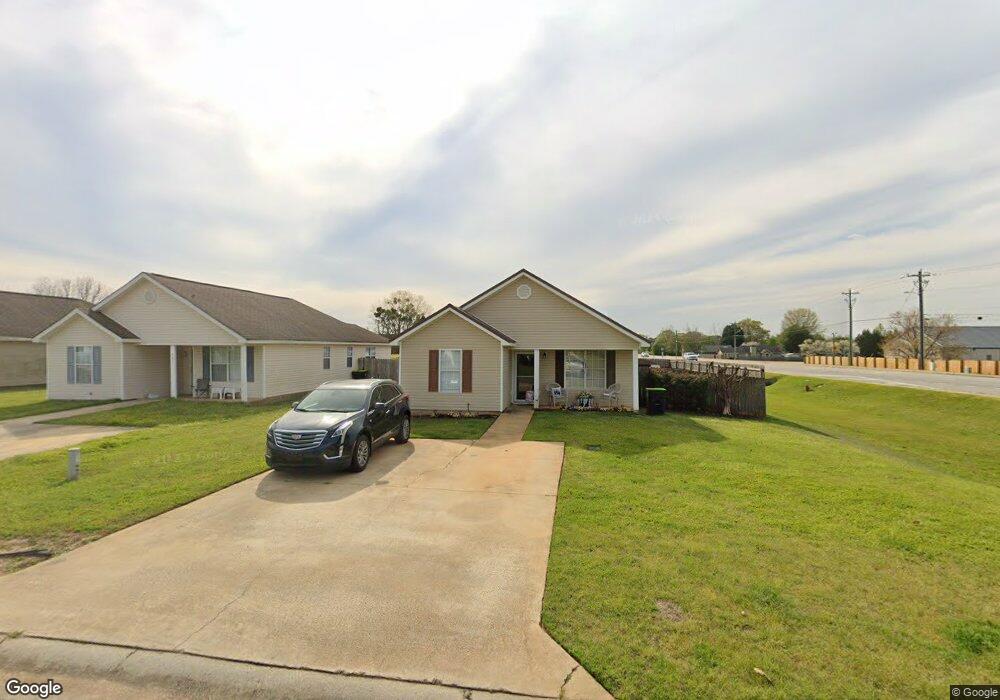
245 Worthington Ln Warner Robins, GA 31088
Estimated Value: $172,000 - $208,000
3
Beds
2
Baths
1,212
Sq Ft
$159/Sq Ft
Est. Value
About This Home
This home is located at 245 Worthington Ln, Warner Robins, GA 31088 and is currently estimated at $192,669, approximately $158 per square foot. 245 Worthington Ln is a home located in Houston County with nearby schools including David A. Perdue Primary School, David A. Perdue Elementary School, and Feagin Mill Middle School.
Ownership History
Date
Name
Owned For
Owner Type
Purchase Details
Closed on
May 9, 2025
Sold by
Merchant Judy S and Hall James R
Bought by
Hall James R
Current Estimated Value
Home Financials for this Owner
Home Financials are based on the most recent Mortgage that was taken out on this home.
Original Mortgage
$113,940
Outstanding Balance
$112,337
Interest Rate
5.82%
Mortgage Type
New Conventional
Estimated Equity
$80,332
Purchase Details
Closed on
Jul 29, 2004
Sold by
Hall James R
Bought by
Merchant Judy S and Hall James R
Purchase Details
Closed on
Mar 27, 2004
Sold by
Hall James R and Hall Michelle L
Bought by
Hall James R
Purchase Details
Closed on
Nov 6, 1998
Sold by
Rhb Piedmont Dev Inc
Bought by
Hall James R and Hall Michelle L
Create a Home Valuation Report for This Property
The Home Valuation Report is an in-depth analysis detailing your home's value as well as a comparison with similar homes in the area
Home Values in the Area
Average Home Value in this Area
Purchase History
| Date | Buyer | Sale Price | Title Company |
|---|---|---|---|
| Hall James R | -- | Old Republic Title | |
| Hall James R | -- | Old Republic Title | |
| Merchant Judy S | -- | -- | |
| Hall James R | -- | -- | |
| Hall James R | $68,900 | -- |
Source: Public Records
Mortgage History
| Date | Status | Borrower | Loan Amount |
|---|---|---|---|
| Open | Hall James R | $113,940 | |
| Closed | Hall James R | $113,940 |
Source: Public Records
Tax History Compared to Growth
Tax History
| Year | Tax Paid | Tax Assessment Tax Assessment Total Assessment is a certain percentage of the fair market value that is determined by local assessors to be the total taxable value of land and additions on the property. | Land | Improvement |
|---|---|---|---|---|
| 2024 | $1,771 | $55,520 | $9,600 | $45,920 |
| 2023 | $1,373 | $43,040 | $8,800 | $34,240 |
| 2022 | $878 | $40,200 | $8,800 | $31,400 |
| 2021 | $817 | $37,320 | $8,800 | $28,520 |
| 2020 | $690 | $31,680 | $6,000 | $25,680 |
| 2019 | $690 | $31,680 | $6,000 | $25,680 |
| 2018 | $664 | $30,560 | $6,000 | $24,560 |
| 2017 | $664 | $30,560 | $6,000 | $24,560 |
| 2016 | $665 | $30,560 | $6,000 | $24,560 |
| 2015 | -- | $30,560 | $6,000 | $24,560 |
| 2014 | $305 | $30,560 | $6,000 | $24,560 |
| 2013 | $305 | $30,560 | $6,000 | $24,560 |
Source: Public Records
Map
Nearby Homes
- 1613 Sweetwater Dr
- 102 Stonemill Dr
- 113 Jana Ct
- 418 Bella Notte Cir Unit 21A
- 500 Bella Notte Cir Unit 16A
- 500 Bella Notte Cir
- 502 Bella Notte Cir
- 502 Bella Notte Cir Unit 15A
- 409 Bella Notte Cir Unit 1D
- 409 Bella Notte Cir
- 416 Bella Notte Cir
- 416 Bella Notte Cir Unit 22A
- 0 Feagin Mill Rd Unit 10572748
- 0 Feagin Mill Rd Unit 254957
- 0 Feagin Mill Rd Unit 180689
- 414 Bella Notte Cir
- 414 Bella Notte Cir Unit 23A
- 243 Worthington Ln
- 241 Worthington Ln
- 239 Worthington Ln
- 230 Worthington Ln
- 100 Brentwood Dr
- 0 Brentwood Dr
- 237 Worthington Ln
- 228 Worthington Ln
- 101 Brentwood Dr
- 226 Worthington Ln
- 235 Worthington Ln
- 224 Worthington Ln
- 222 Worthington Ln
- 233 Worthington Ln
- 121 Haverhill Cir
- 118 Oak Meadow Terrace
- 220 Worthington Ln
- 119 Haverhill Cir
- 102 Brentwood Dr
- 231 Worthington Ln