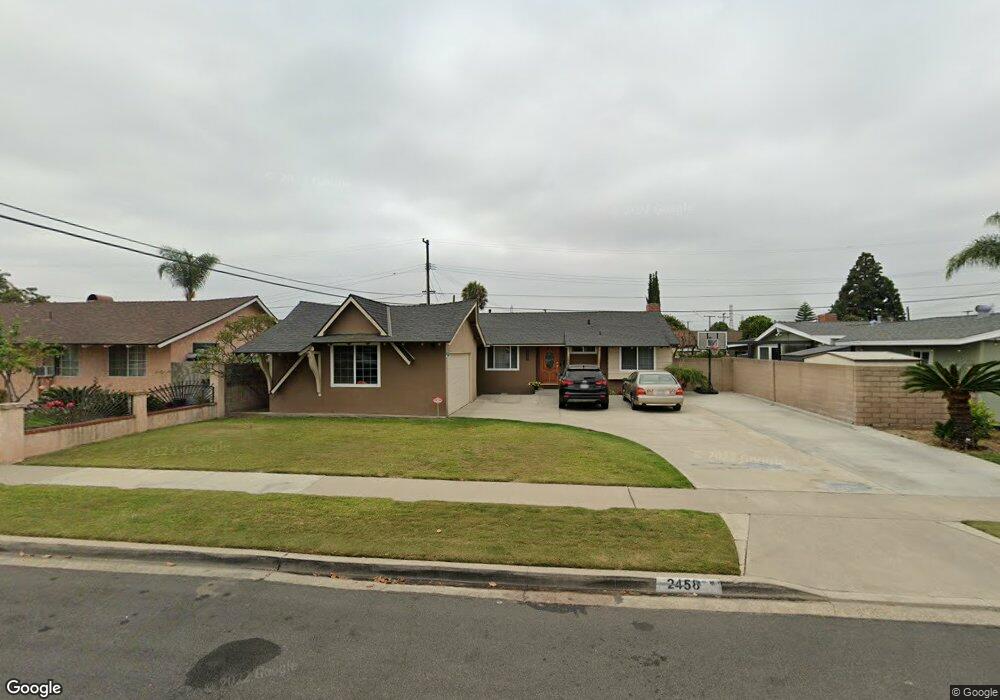
2458 W Lullaby Ln Anaheim, CA 92804
West Anaheim NeighborhoodEstimated Value: $877,000 - $1,005,000
3
Beds
2
Baths
1,358
Sq Ft
$678/Sq Ft
Est. Value
About This Home
This home is located at 2458 W Lullaby Ln, Anaheim, CA 92804 and is currently estimated at $921,119, approximately $678 per square foot. 2458 W Lullaby Ln is a home located in Orange County with nearby schools including Jonas E. Salk Elementary School, Dale Jr High School, and Magnolia High.
Ownership History
Date
Name
Owned For
Owner Type
Purchase Details
Closed on
Apr 2, 2024
Sold by
Winterburn Jeffrey Alan and Winterburn Tina Gail
Bought by
Winterburn Family Trust and Winterburn
Current Estimated Value
Purchase Details
Closed on
Mar 15, 2019
Sold by
Herron John and Herron Judy
Bought by
Winterburn Jeffrey and Winterburn Tina
Purchase Details
Closed on
Jan 15, 2002
Sold by
The Herron Family Trust
Bought by
Winterburn Jeffrey and Winterburn Tina G
Home Financials for this Owner
Home Financials are based on the most recent Mortgage that was taken out on this home.
Original Mortgage
$200,000
Interest Rate
7.17%
Mortgage Type
Seller Take Back
Purchase Details
Closed on
Jun 11, 1996
Sold by
Herron John H and Herron Judy G
Bought by
Herron John H and Herron Judy G
Create a Home Valuation Report for This Property
The Home Valuation Report is an in-depth analysis detailing your home's value as well as a comparison with similar homes in the area
Home Values in the Area
Average Home Value in this Area
Purchase History
| Date | Buyer | Sale Price | Title Company |
|---|---|---|---|
| Winterburn Family Trust | -- | None Listed On Document | |
| Winterburn Jeffrey Alan | -- | None Listed On Document | |
| Winterburn Jeffrey | -- | None Available | |
| Winterburn Jeffrey | -- | Commonwealth Land Title | |
| Herron John H | -- | -- |
Source: Public Records
Mortgage History
| Date | Status | Borrower | Loan Amount |
|---|---|---|---|
| Previous Owner | Winterburn Jeffrey | $200,000 |
Source: Public Records
Tax History Compared to Growth
Tax History
| Year | Tax Paid | Tax Assessment Tax Assessment Total Assessment is a certain percentage of the fair market value that is determined by local assessors to be the total taxable value of land and additions on the property. | Land | Improvement |
|---|---|---|---|---|
| 2025 | $2,425 | $199,123 | $103,516 | $95,607 |
| 2024 | $2,425 | $195,219 | $101,486 | $93,733 |
| 2023 | $2,359 | $191,392 | $99,496 | $91,896 |
| 2022 | $2,331 | $187,640 | $97,545 | $90,095 |
| 2021 | $2,302 | $183,961 | $95,632 | $88,329 |
| 2020 | $2,287 | $182,075 | $94,651 | $87,424 |
| 2019 | $2,234 | $178,505 | $92,795 | $85,710 |
| 2018 | $2,206 | $175,005 | $90,975 | $84,030 |
| 2017 | $2,131 | $171,574 | $89,191 | $82,383 |
| 2016 | $2,118 | $168,210 | $87,442 | $80,768 |
| 2015 | $2,098 | $165,684 | $86,129 | $79,555 |
| 2014 | $1,997 | $162,439 | $84,442 | $77,997 |
Source: Public Records
Map
Nearby Homes
- 9272 Cerritos Ave
- 9155 Pacific Ave Unit 265
- 2533 W Chanticleer Rd
- 2631 W Cerritos Ave
- 90093 Stacie Ln
- 9041 Stacie Ln Unit 12
- 8921 Kennelly Ln
- 10301 Rhiems Rd
- 927 S Webster Ave
- 10301 Antigua St
- 9592 Katella Ave
- 8971 Poinsettia Ln
- 837 S Magnolia Ave
- 10211 Macduff St
- 2517 W Merle Place
- 1234 S Macduff St
- 11172 Homeway Dr
- 10800 Dale Ave Unit 129
- 10800 Dale Ave Unit 705
- 8681 Katella Ave
- 2462 W Lullaby Ln
- 2454 W Lullaby Ln
- 2459 W Cerritos Ave
- 2468 W Lullaby Ln
- 2455 W Cerritos Ave
- 2463 W Cerritos Ave
- 2459 W Lullaby Ln
- 2463 W Lullaby Ln
- 2455 W Lullaby Ln
- 2469 W Cerritos Ave
- 2470 W Lullaby Ln
- 2467 W Lullaby Ln
- 1444 S Garza St
- 1440 S Garza St
- 1450 S Garza St
- 1436 S Garza St
- 2471 W Cerritos Ave
- 2471 W Lullaby Ln
- 2445 W Cerritos Ave
- 1432 S Garza St