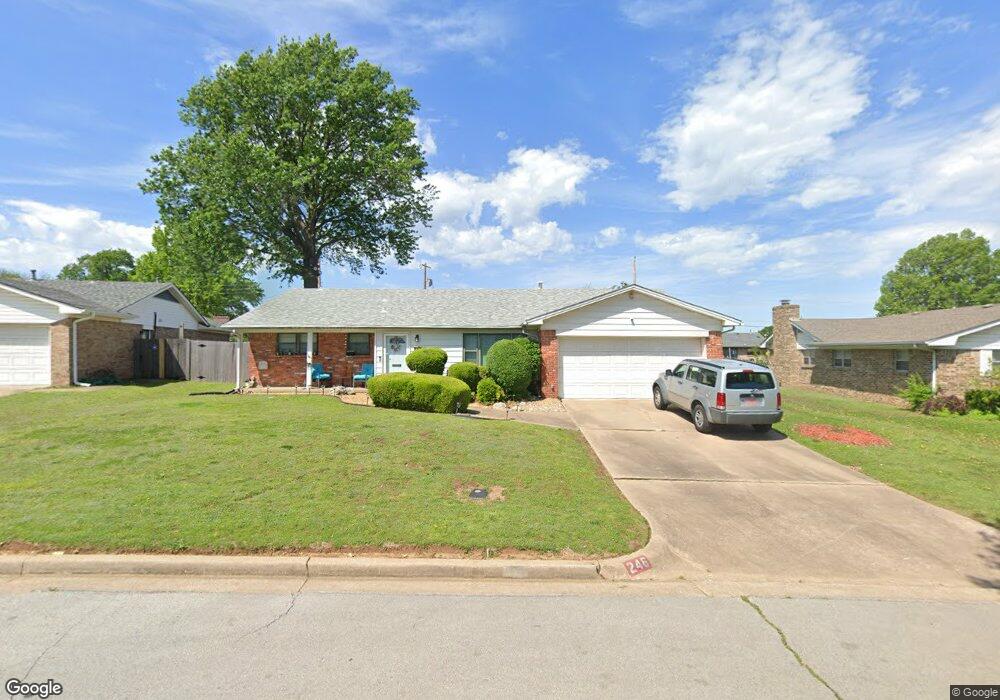
246 S 118th East Ave Tulsa, OK 74128
Western Village NeighborhoodEstimated Value: $186,000 - $241,000
3
Beds
2
Baths
2,073
Sq Ft
$104/Sq Ft
Est. Value
About This Home
This home is located at 246 S 118th East Ave, Tulsa, OK 74128 and is currently estimated at $214,902, approximately $103 per square foot. 246 S 118th East Ave is a home located in Tulsa County with nearby schools including Kerr Elementary School, East Central High School, and Wright Christian Academy.
Ownership History
Date
Name
Owned For
Owner Type
Purchase Details
Closed on
Mar 27, 2012
Sold by
Frazier Shalaya and Brown Shalaya
Bought by
Frazier Gordon A
Current Estimated Value
Home Financials for this Owner
Home Financials are based on the most recent Mortgage that was taken out on this home.
Original Mortgage
$96,340
Outstanding Balance
$66,574
Interest Rate
3.92%
Mortgage Type
VA
Estimated Equity
$148,328
Purchase Details
Closed on
May 22, 2009
Sold by
Obrien Michelle Ann
Bought by
Brown Shalaya
Home Financials for this Owner
Home Financials are based on the most recent Mortgage that was taken out on this home.
Original Mortgage
$97,073
Interest Rate
4.76%
Mortgage Type
FHA
Purchase Details
Closed on
Jun 15, 2001
Sold by
Obrien Daniel E and Obrien Michelle Ann
Bought by
Obrien Daniel E and Obrien Michelle Ann
Purchase Details
Closed on
May 1, 1991
Create a Home Valuation Report for This Property
The Home Valuation Report is an in-depth analysis detailing your home's value as well as a comparison with similar homes in the area
Home Values in the Area
Average Home Value in this Area
Purchase History
| Date | Buyer | Sale Price | Title Company |
|---|---|---|---|
| Frazier Gordon A | $96,500 | Tulsa Abstract & Title Co | |
| Brown Shalaya | $100,000 | None Available | |
| Obrien Daniel E | -- | Tulsa Abstract & Title Co | |
| -- | $60,000 | -- |
Source: Public Records
Mortgage History
| Date | Status | Borrower | Loan Amount |
|---|---|---|---|
| Open | Frazier Gordon A | $96,340 | |
| Previous Owner | Brown Shalaya | $97,073 |
Source: Public Records
Tax History Compared to Growth
Tax History
| Year | Tax Paid | Tax Assessment Tax Assessment Total Assessment is a certain percentage of the fair market value that is determined by local assessors to be the total taxable value of land and additions on the property. | Land | Improvement |
|---|---|---|---|---|
| 2024 | $1,641 | $13,353 | $1,529 | $11,824 |
| 2023 | $1,641 | $13,934 | $1,581 | $12,353 |
| 2022 | $1,670 | $12,528 | $1,803 | $10,725 |
| 2021 | $1,603 | $12,134 | $1,746 | $10,388 |
| 2020 | $1,531 | $11,752 | $1,691 | $10,061 |
| 2019 | $1,559 | $11,381 | $1,638 | $9,743 |
| 2018 | $1,513 | $11,020 | $1,586 | $9,434 |
| 2017 | $1,463 | $11,670 | $1,680 | $9,990 |
| 2016 | $1,387 | $11,330 | $1,631 | $9,699 |
| 2015 | $1,345 | $11,000 | $1,936 | $9,064 |
| 2014 | $1,332 | $11,000 | $1,936 | $9,064 |
Source: Public Records
Map
Nearby Homes
- 244 S 120th East Ave
- 11726 E 7th St
- 11541 E 7th Place
- 11333 E 6th St
- 10931 E 4th Place
- 133 S 107th East Ave
- 527 S 108th East Ave
- 610 S 108th East Ave
- 10611 E 4th Place
- 617 S 106th East Ave
- 0 E 11th St S Unit 2529262
- 106 S 111th East Ave
- 0 East Ave Unit 2501591
- 241 S 104th East Ave
- 234 S 104th East Ave
- 46 S 104th East Ave
- 11031 E 11th Place Unit 31A
- 11010 E 13th St Unit 48
- 11003 E 13th St Unit 40-2C
- 1120 S 110th Ave E Unit 12-2C
- 252 S 118th East Ave
- 240 S 118th East Ave
- 249 S 117th East Place
- 257 S 117th East Place
- 241 S 117th East Place
- 303 S 117th East Place
- 258 S 118th East Ave
- 236 S 118th East Ave
- 243 S 118th East Ave
- 249 S 118th East Ave
- 237 S 117th East Place
- 309 S 117th East Place
- 255 S 118th East Ave
- 237 S 118th East Ave
- 262 S 118th East Ave
- 230 S 118th East Ave
- 231 S 117th East Place
- 311 S 117th East Place
- 311 S 117th Place E
- 231 S 118th East Ave