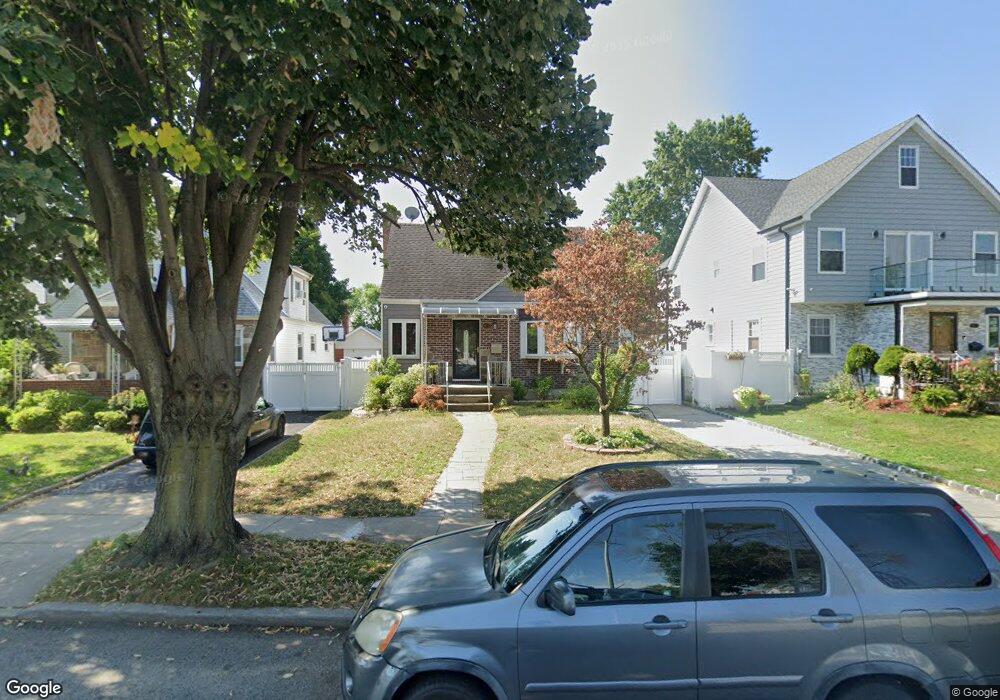
24604 85th Ave Bellerose, NY 11426
Bellerose NeighborhoodEstimated Value: $794,000 - $912,000
--
Bed
--
Bath
1,171
Sq Ft
$736/Sq Ft
Est. Value
About This Home
This home is located at 24604 85th Ave, Bellerose, NY 11426 and is currently estimated at $861,905, approximately $736 per square foot. 24604 85th Ave is a home located in Queens County with nearby schools including P.S.133Q, Fremont/Hay Elementary School, and Irwin Altman Middle School 172.
Ownership History
Date
Name
Owned For
Owner Type
Purchase Details
Closed on
Jan 21, 2021
Sold by
Mehra Rajan H and Mehra Sheela R
Bought by
Khan Md S and Nahar Shamima
Current Estimated Value
Home Financials for this Owner
Home Financials are based on the most recent Mortgage that was taken out on this home.
Original Mortgage
$500,000
Outstanding Balance
$443,879
Interest Rate
2.67%
Mortgage Type
Purchase Money Mortgage
Estimated Equity
$418,026
Purchase Details
Closed on
Nov 12, 2010
Sold by
Sclafani Frank and Sclafani Cathleen
Bought by
Mehra Rajan and Mehra Sheela
Home Financials for this Owner
Home Financials are based on the most recent Mortgage that was taken out on this home.
Original Mortgage
$483,489
Interest Rate
2.75%
Mortgage Type
FHA
Purchase Details
Closed on
Nov 13, 1995
Sold by
Sclafani Frank
Bought by
Sclafani Frank and Sclafani Cathleen
Create a Home Valuation Report for This Property
The Home Valuation Report is an in-depth analysis detailing your home's value as well as a comparison with similar homes in the area
Home Values in the Area
Average Home Value in this Area
Purchase History
| Date | Buyer | Sale Price | Title Company |
|---|---|---|---|
| Khan Md S | $715,000 | -- | |
| Khan Md S | $715,000 | -- | |
| Khan Md S | $715,000 | -- | |
| Mehra Rajan | $490,000 | -- | |
| Mehra Rajan | $490,000 | -- | |
| Sclafani Frank | -- | Uslife Title Insurance Compa | |
| Sclafani Frank | -- | Uslife Title Insurance Compa |
Source: Public Records
Mortgage History
| Date | Status | Borrower | Loan Amount |
|---|---|---|---|
| Open | Khan Md S | $500,000 | |
| Closed | Khan Md S | $500,000 | |
| Previous Owner | Mehra Rajan | $483,489 |
Source: Public Records
Tax History Compared to Growth
Tax History
| Year | Tax Paid | Tax Assessment Tax Assessment Total Assessment is a certain percentage of the fair market value that is determined by local assessors to be the total taxable value of land and additions on the property. | Land | Improvement |
|---|---|---|---|---|
| 2025 | $8,116 | $42,832 | $10,950 | $31,882 |
| 2024 | $8,116 | $40,409 | $12,083 | $28,326 |
| 2023 | $7,796 | $38,816 | $10,577 | $28,239 |
| 2022 | $7,550 | $45,960 | $12,900 | $33,060 |
| 2021 | $7,960 | $42,900 | $12,900 | $30,000 |
| 2020 | $7,555 | $36,900 | $12,900 | $24,000 |
| 2019 | $7,044 | $39,480 | $12,900 | $26,580 |
| 2018 | $6,594 | $32,347 | $9,795 | $22,552 |
| 2017 | $6,425 | $31,518 | $10,190 | $21,328 |
| 2016 | $6,301 | $31,518 | $10,190 | $21,328 |
| 2015 | $3,586 | $29,744 | $11,692 | $18,052 |
| 2014 | $3,586 | $28,062 | $11,976 | $16,086 |
Source: Public Records
Map
Nearby Homes
- 84-17 247th St
- 246-59 86th Rd
- 84-25 249th St
- 85-16 250th St
- 24612 86th Rd
- 8344 247th St
- 83-46 248th St
- 246-31 87th Ave
- 84-68 251st St
- 24607 87th Ave
- 246-62 87th Ave
- 87-01 Commonwealth Blvd
- 83-27 Commonwealth Blvd
- 83-17 247th St
- 88-19 247th St
- 241-10 86th Ave
- 248-29 88th Rd
- 24134 87th Ave
- 85-40 253rd St
- 23913 86th Ave
- 246-04 85th Ave
- 24608 85th Ave
- 24514 85th Ave
- 24514 85th Ave
- 24612 85th Ave
- 24625 85th Rd
- 24631 85th Rd
- 8507 Commonwealth Blvd
- 8511 Commonwealth Blvd
- 8503 Commonwealth Blvd
- 24635 85th Rd
- 8515 Commonwealth Blvd
- 85-15 Commonwealth Blvd
- 8453 246th St
- 8504 247th St
- 8508 247th St
- 8519 Commonwealth Blvd
- 85-08 247th St
- 8512 247th St
- 85-04 247th St