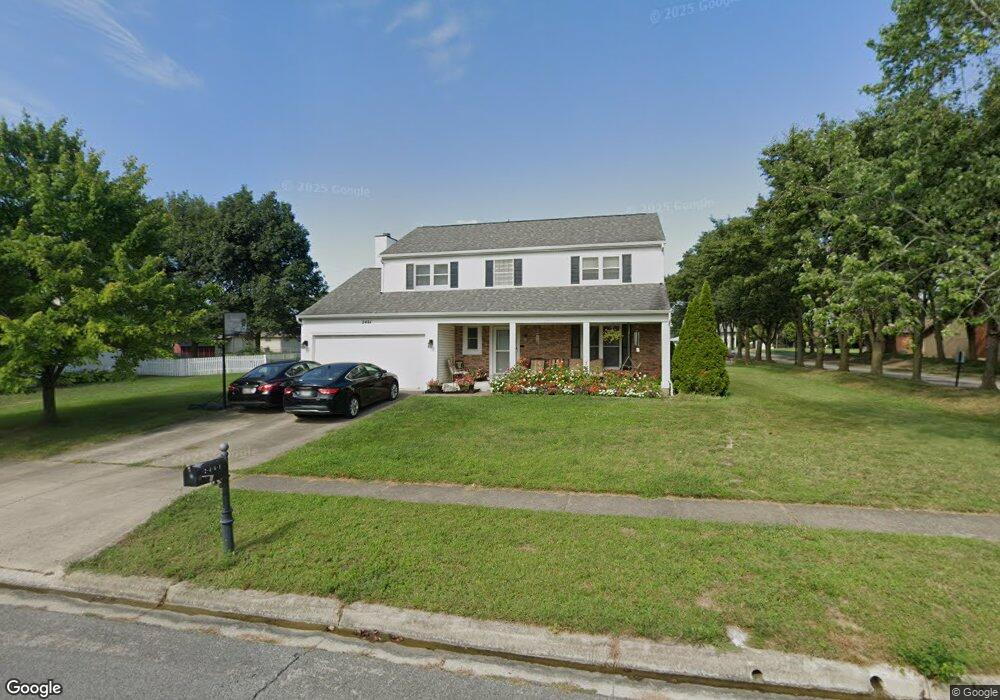
2461 Ziner Cir S Grove City, OH 43123
Estimated Value: $380,000 - $418,000
4
Beds
3
Baths
2,043
Sq Ft
$193/Sq Ft
Est. Value
About This Home
This home is located at 2461 Ziner Cir S, Grove City, OH 43123 and is currently estimated at $393,405, approximately $192 per square foot. 2461 Ziner Cir S is a home located in Franklin County with nearby schools including Monterey Elementary School, Park Street Intermediate School, and Grove City High School.
Ownership History
Date
Name
Owned For
Owner Type
Purchase Details
Closed on
Dec 22, 2008
Sold by
Batdorf Brian W and Batdorf April E
Bought by
Davis Brian and Davis Kendra L
Current Estimated Value
Home Financials for this Owner
Home Financials are based on the most recent Mortgage that was taken out on this home.
Original Mortgage
$95,000
Outstanding Balance
$62,955
Interest Rate
6.19%
Mortgage Type
Purchase Money Mortgage
Estimated Equity
$330,450
Purchase Details
Closed on
Sep 28, 2001
Sold by
Edwards Jeffery L
Bought by
Batdorf Brian W and Batdorf April E
Home Financials for this Owner
Home Financials are based on the most recent Mortgage that was taken out on this home.
Original Mortgage
$174,580
Interest Rate
6.99%
Mortgage Type
FHA
Purchase Details
Closed on
Nov 8, 1994
Sold by
Sovereighn Dev Corp
Bought by
Jeffery L Edwards
Create a Home Valuation Report for This Property
The Home Valuation Report is an in-depth analysis detailing your home's value as well as a comparison with similar homes in the area
Home Values in the Area
Average Home Value in this Area
Purchase History
| Date | Buyer | Sale Price | Title Company |
|---|---|---|---|
| Davis Brian | $135,000 | Attorney | |
| Batdorf Brian W | $176,000 | Chicago Title | |
| Jeffery L Edwards | $139,285 | -- |
Source: Public Records
Mortgage History
| Date | Status | Borrower | Loan Amount |
|---|---|---|---|
| Open | Davis Brian | $95,000 | |
| Previous Owner | Batdorf Brian W | $174,580 |
Source: Public Records
Tax History Compared to Growth
Tax History
| Year | Tax Paid | Tax Assessment Tax Assessment Total Assessment is a certain percentage of the fair market value that is determined by local assessors to be the total taxable value of land and additions on the property. | Land | Improvement |
|---|---|---|---|---|
| 2024 | $5,619 | $123,560 | $32,520 | $91,040 |
| 2023 | $5,539 | $123,560 | $32,520 | $91,040 |
| 2022 | $4,986 | $81,760 | $14,700 | $67,060 |
| 2021 | $5,082 | $81,760 | $14,700 | $67,060 |
| 2020 | $5,066 | $81,760 | $14,700 | $67,060 |
| 2019 | $4,502 | $67,410 | $12,250 | $55,160 |
| 2018 | $4,352 | $67,410 | $12,250 | $55,160 |
| 2017 | $4,469 | $67,410 | $12,250 | $55,160 |
| 2016 | $4,217 | $58,180 | $11,240 | $46,940 |
| 2015 | $4,218 | $58,180 | $11,240 | $46,940 |
| 2014 | $4,221 | $58,180 | $11,240 | $46,940 |
| 2013 | $1,992 | $58,170 | $11,235 | $46,935 |
Source: Public Records
Map
Nearby Homes
- 3542 Hoover Rd
- 2545 Scott Ct
- 2430 Sportsman Dr
- 2571 Scott Ct
- 3474 Highland St
- 2300 Ziner Cir N
- 3378 Josephine Cir
- 3333 Tareyton Dr
- 3643 Santa Maria Dr
- 3454 Independence St
- 3660 Brinkman Dr
- 3400 Marshrun Dr
- 3815 Queen Anne Place Unit B19
- 3343 Marshrun Dr
- 3828 Queen Anne Place Unit B8
- 3830 Queen Anne Place Unit A9
- 3267 Castleton St
- 3805 Santa Maria Dr
- 3187 Parkview Cir Unit 3187
- 3429 Devin Rd
- 3565 Ziner Cir N
- 2453 Ziner Cir S
- 2444 Ziner Cir S
- 3528 Hoover Rd
- 2441 Ziner Cir N
- 2445 Ziner Cir S
- 2424 Ziner Cir S
- 2437 Ziner Cir S
- 2425 Ziner Cir N
- 2430 Ziner Cir N
- 2427 Ziner Cir S
- 2448 Huntmaster Ln Unit 2448
- 2416 Ziner Cir S
- 3556 Hoover Rd
- 2417 Ziner Cir N
- 2454 Huntmaster Ln
- 2422 Ziner Cir N
- 2438 Huntmaster Ln
- 2419 Ziner Cir S
- 3523 Hoover Rd