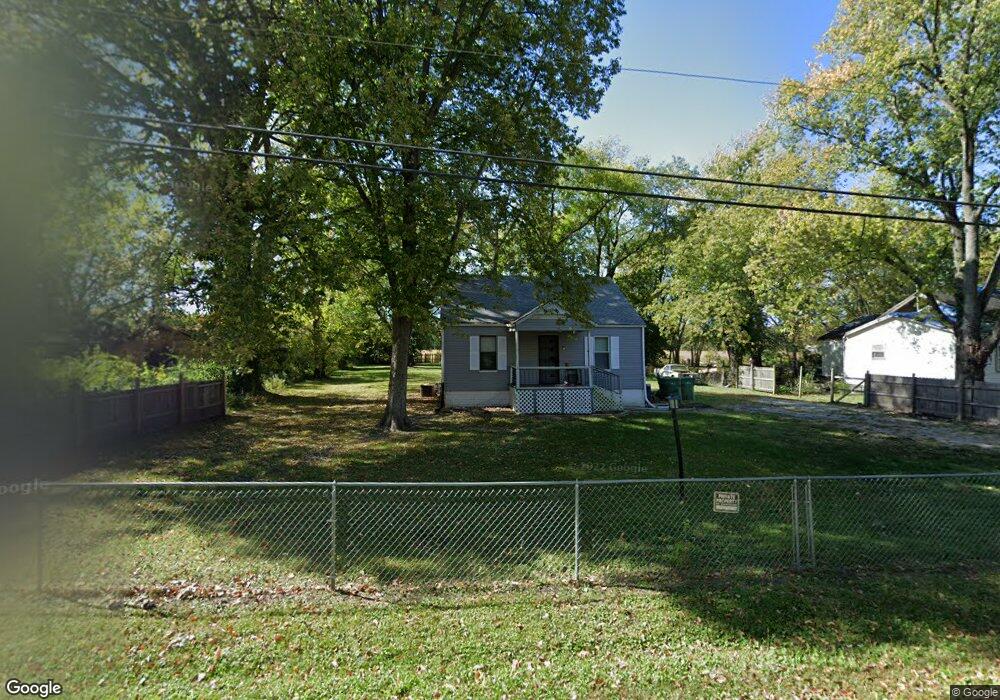
2464 Renois Ln East Saint Louis, IL 62206
Estimated Value: $44,000 - $103,000
--
Bed
--
Bath
1,056
Sq Ft
$62/Sq Ft
Est. Value
About This Home
This home is located at 2464 Renois Ln, East Saint Louis, IL 62206 and is currently estimated at $64,964, approximately $61 per square foot. 2464 Renois Ln is a home located in St. Clair County.
Ownership History
Date
Name
Owned For
Owner Type
Purchase Details
Closed on
Oct 12, 2016
Sold by
Saint Clair County
Bought by
Stewart Christopher M
Current Estimated Value
Purchase Details
Closed on
Jul 27, 2015
Sold by
County Of Saint Clair
Bought by
Saint Clair County
Purchase Details
Closed on
Jan 12, 2012
Sold by
County Of Saint Clair
Bought by
Gardner Vanessa V
Purchase Details
Closed on
Jun 28, 2011
Sold by
Gardner Vanessa V
Bought by
County Of Saint Clair
Purchase Details
Closed on
Nov 20, 2003
Sold by
Sendejas Angela D
Bought by
Gardner Vanessa V
Create a Home Valuation Report for This Property
The Home Valuation Report is an in-depth analysis detailing your home's value as well as a comparison with similar homes in the area
Home Values in the Area
Average Home Value in this Area
Purchase History
| Date | Buyer | Sale Price | Title Company |
|---|---|---|---|
| Stewart Christopher M | -- | Attorney | |
| Saint Clair County | -- | Attorney | |
| Gardner Vanessa V | -- | None Available | |
| County Of Saint Clair | -- | None Available | |
| Gardner Vanessa V | $10,000 | -- |
Source: Public Records
Tax History Compared to Growth
Tax History
| Year | Tax Paid | Tax Assessment Tax Assessment Total Assessment is a certain percentage of the fair market value that is determined by local assessors to be the total taxable value of land and additions on the property. | Land | Improvement |
|---|---|---|---|---|
| 2024 | $1,339 | $8,978 | $1,117 | $7,861 |
| 2023 | $1,202 | $8,115 | $1,010 | $7,105 |
| 2022 | $1,031 | $7,112 | $885 | $6,227 |
| 2021 | $1,069 | $6,740 | $839 | $5,901 |
| 2020 | $942 | $5,662 | $878 | $4,784 |
| 2019 | $977 | $5,662 | $878 | $4,784 |
| 2018 | $988 | $5,745 | $891 | $4,854 |
| 2017 | $941 | $5,607 | $870 | $4,737 |
| 2016 | $0 | $102 | $51 | $51 |
| 2014 | $1,227 | $7,951 | $858 | $7,093 |
| 2013 | $2,120 | $7,458 | $805 | $6,653 |
Source: Public Records
Map
Nearby Homes