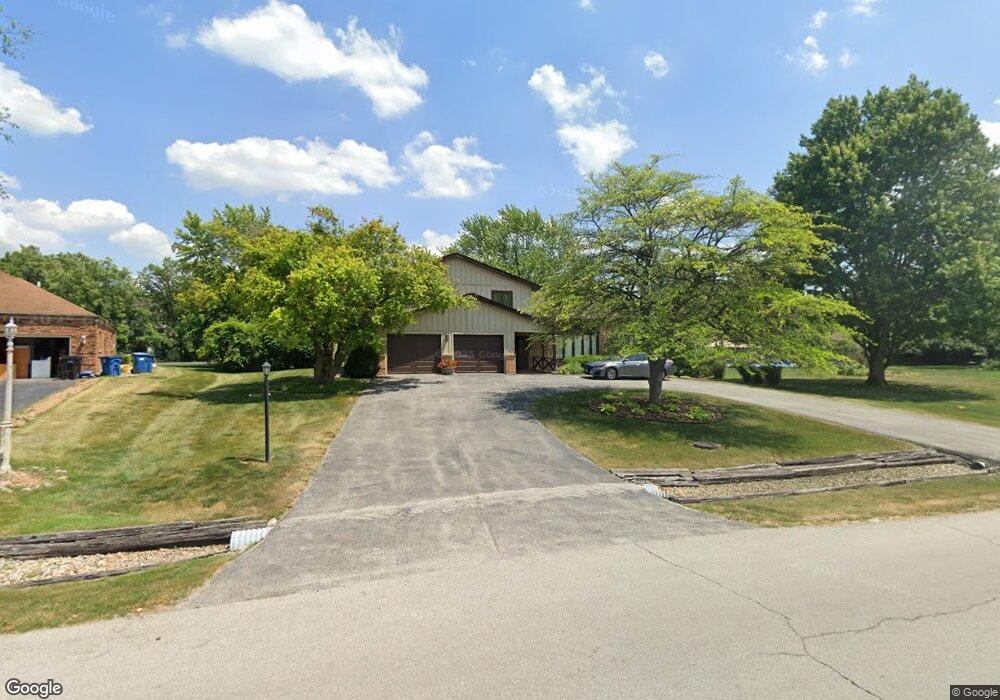
24743 S Chestnut Ln Crete, IL 60417
Goodenow NeighborhoodEstimated Value: $339,000 - $391,000
--
Bed
--
Bath
2,796
Sq Ft
$131/Sq Ft
Est. Value
About This Home
This home is located at 24743 S Chestnut Ln, Crete, IL 60417 and is currently estimated at $366,295, approximately $131 per square foot. 24743 S Chestnut Ln is a home located in Will County with nearby schools including Balmoral Elementary School, Crete-Monee Middle School, and Crete-Monee High School.
Create a Home Valuation Report for This Property
The Home Valuation Report is an in-depth analysis detailing your home's value as well as a comparison with similar homes in the area
Home Values in the Area
Average Home Value in this Area
Tax History Compared to Growth
Tax History
| Year | Tax Paid | Tax Assessment Tax Assessment Total Assessment is a certain percentage of the fair market value that is determined by local assessors to be the total taxable value of land and additions on the property. | Land | Improvement |
|---|---|---|---|---|
| 2024 | $10,426 | $124,486 | $27,480 | $97,006 |
| 2023 | $10,426 | $111,158 | $24,538 | $86,620 |
| 2022 | $9,448 | $98,790 | $21,808 | $76,982 |
| 2021 | $8,908 | $90,450 | $19,967 | $70,483 |
| 2020 | $8,645 | $84,770 | $18,713 | $66,057 |
| 2019 | $8,252 | $79,671 | $17,587 | $62,084 |
| 2018 | $7,381 | $77,956 | $17,208 | $60,748 |
| 2017 | $7,636 | $71,816 | $15,853 | $55,963 |
| 2016 | $7,612 | $71,353 | $15,751 | $55,602 |
| 2015 | $7,946 | $68,095 | $12,358 | $55,737 |
| 2014 | $7,946 | $68,783 | $12,483 | $56,300 |
| 2013 | $7,946 | $72,077 | $13,081 | $58,996 |
Source: Public Records
Map
Nearby Homes
- 24827 S Chestnut Ln
- 3033 E Hickory Ln
- 24760 S Hickory Ct
- 3161 E Bending Creek Trail
- 24541 S Wildwood Trail
- 24644 S Mulberry Ln Unit 1
- 2938 E Shagbark Trail
- 2858 E Bending Creek Trail
- 24360 S Timberline Trail
- 24219 S Lakeside Trail
- 15660 98th Ave
- 15642 97th Ln
- 9832 Kreitzburg St
- 9842 Kreitzburg St
- 15596 98th Ave
- 24307 S Plum Valley Dr
- 869 Yorkshire Terrace
- 3317 E Buried Oak Dr
- 2639 E Shady Grove Ct
- 3460 E Challas Entrance
- 24735 S Chestnut Ln
- 24759 S Chestnut Ln
- 24725 S Chestnut Ln
- 24736 S Chestnut Ln
- 24736 S Oak Ln
- 24758 S Oak Ln
- 24760 S Chestnut Ln
- 24837 S Chestnut Ln
- 24722 S Oak Ln
- 24717 S Chestnut Ln
- 3130 E Hickory Ln
- 3146 E Cedar Ln
- 24804 S Oak Ln
- 24847 S Chestnut Ln
- 3143 E Cedar Ln
- 3118 E Hickory Ln Unit 3
- 3138 E Cedar Ln
- 24838 S Chestnut Ln
- 3065 E Hickory Ln
- 3108 E Hickory Ln