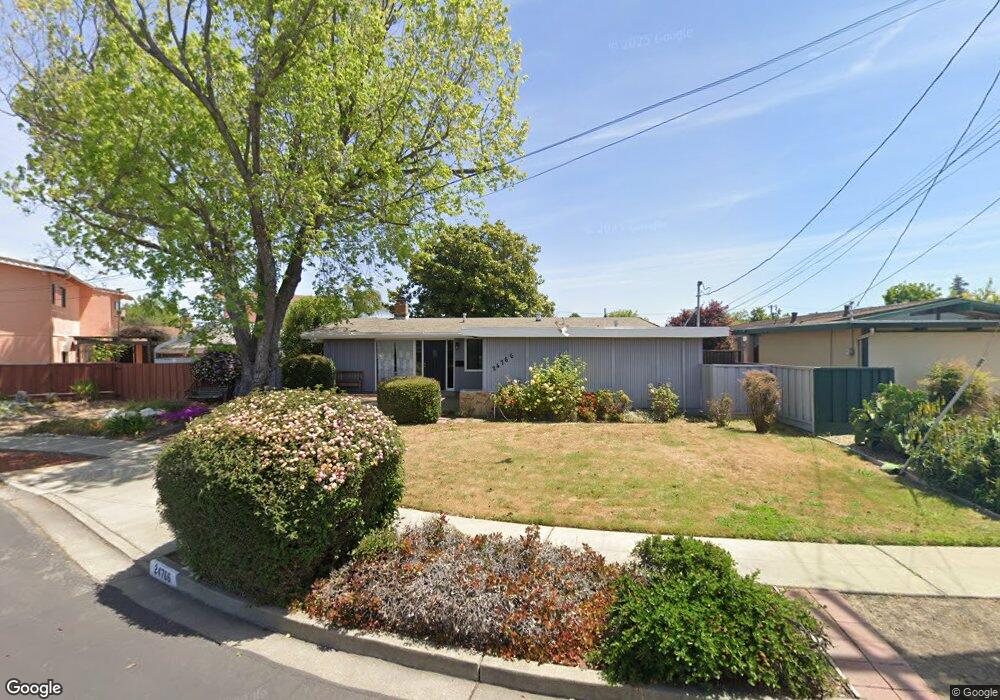
24766 Papaya St Hayward, CA 94545
Southgate NeighborhoodEstimated Value: $908,384 - $966,000
3
Beds
2
Baths
1,432
Sq Ft
$653/Sq Ft
Est. Value
About This Home
This home is located at 24766 Papaya St, Hayward, CA 94545 and is currently estimated at $934,846, approximately $652 per square foot. 24766 Papaya St is a home located in Alameda County with nearby schools including Eden Gardens Elementary School, Anthony W. Ochoa Middle School, and Mt. Eden High School.
Ownership History
Date
Name
Owned For
Owner Type
Purchase Details
Closed on
Aug 13, 2022
Sold by
Abbott Jason P
Bought by
Trust Of Jason P Abbott
Current Estimated Value
Purchase Details
Closed on
Jun 23, 2017
Sold by
Davis James Andrew and Sears Kathryn L
Bought by
Abbott Jason P
Home Financials for this Owner
Home Financials are based on the most recent Mortgage that was taken out on this home.
Original Mortgage
$250,000
Interest Rate
4.02%
Mortgage Type
New Conventional
Purchase Details
Closed on
May 31, 2016
Sold by
Davis Dan William
Bought by
Davis Dan William and Davis Elena F
Purchase Details
Closed on
Oct 10, 2011
Sold by
Sears Kathryn L and Davis Trust
Bought by
Davis James Andrew and Davis Dan William
Purchase Details
Closed on
Mar 30, 1995
Sold by
Davis James Miller and Davis Joan Eleanor
Bought by
Davis James M and Davis Joan E
Create a Home Valuation Report for This Property
The Home Valuation Report is an in-depth analysis detailing your home's value as well as a comparison with similar homes in the area
Home Values in the Area
Average Home Value in this Area
Purchase History
| Date | Buyer | Sale Price | Title Company |
|---|---|---|---|
| Trust Of Jason P Abbott | -- | -- | |
| Abbott Jason P | $622,000 | Old Republic Title Company | |
| Davis Dan William | -- | None Available | |
| Davis James Andrew | -- | None Available | |
| Davis James M | -- | -- |
Source: Public Records
Mortgage History
| Date | Status | Borrower | Loan Amount |
|---|---|---|---|
| Previous Owner | Abbott Jason P | $250,000 |
Source: Public Records
Tax History Compared to Growth
Tax History
| Year | Tax Paid | Tax Assessment Tax Assessment Total Assessment is a certain percentage of the fair market value that is determined by local assessors to be the total taxable value of land and additions on the property. | Land | Improvement |
|---|---|---|---|---|
| 2025 | $8,709 | $718,214 | $220,506 | $504,708 |
| 2024 | $8,709 | $703,997 | $216,183 | $494,814 |
| 2023 | $8,577 | $697,057 | $211,945 | $485,112 |
| 2022 | $8,408 | $676,390 | $207,789 | $475,601 |
| 2021 | $8,339 | $662,993 | $203,716 | $466,277 |
| 2020 | $8,245 | $663,126 | $201,628 | $461,498 |
| 2019 | $8,312 | $650,128 | $197,676 | $452,452 |
| 2018 | $7,758 | $634,440 | $193,800 | $440,640 |
| 2017 | $1,099 | $69,847 | $27,207 | $42,640 |
| 2016 | $1,015 | $68,478 | $26,674 | $41,804 |
| 2015 | $999 | $67,449 | $26,273 | $41,176 |
| 2014 | $961 | $66,128 | $25,759 | $40,369 |
Source: Public Records
Map
Nearby Homes
- 24796 Pear St
- 25192 Copa Del Oro Dr Unit 104
- 25163 Copa Del Oro Dr Unit 202
- 794 Resota St
- 1280 Stanhope Ln Unit 343
- 1256 Stanhope Ln Unit 254
- 25930 Kay Ave Unit 201
- 25930 Kay Ave Unit 308
- 1291 Xavier Ave
- 512 Teasdale Place
- 522 Lagunitas Ln
- 828 Bluefield Ln
- 24282 Willimet Way
- 26171 Eldridge Ave
- 23875 Wright Dr
- 23735 Stonewall Ave
- 1150 W Winton Ave Unit 541
- 25275 Tarman Ave
- 307 Toscana Way
- 25353 Tarman Ave
- 24758 Papaya St
- 24765 Calaroga Ave
- 24757 Calaroga Ave
- 24782 Papaya St
- 973 Currant Way
- 24771 Calaroga Ave
- 24775 Papaya St
- 24749 Calaroga Ave
- 981 Currant Way
- 24790 Papaya St
- 24779 Calaroga Ave
- 24741 Calaroga Ave
- 24768 Mango St
- 989 Currant Way
- 24791 Papaya St
- 24784 Mango St
- 24798 Papaya St
- 24787 Calaroga Ave
- 997 Currant Way
- 24733 Calaroga Ave