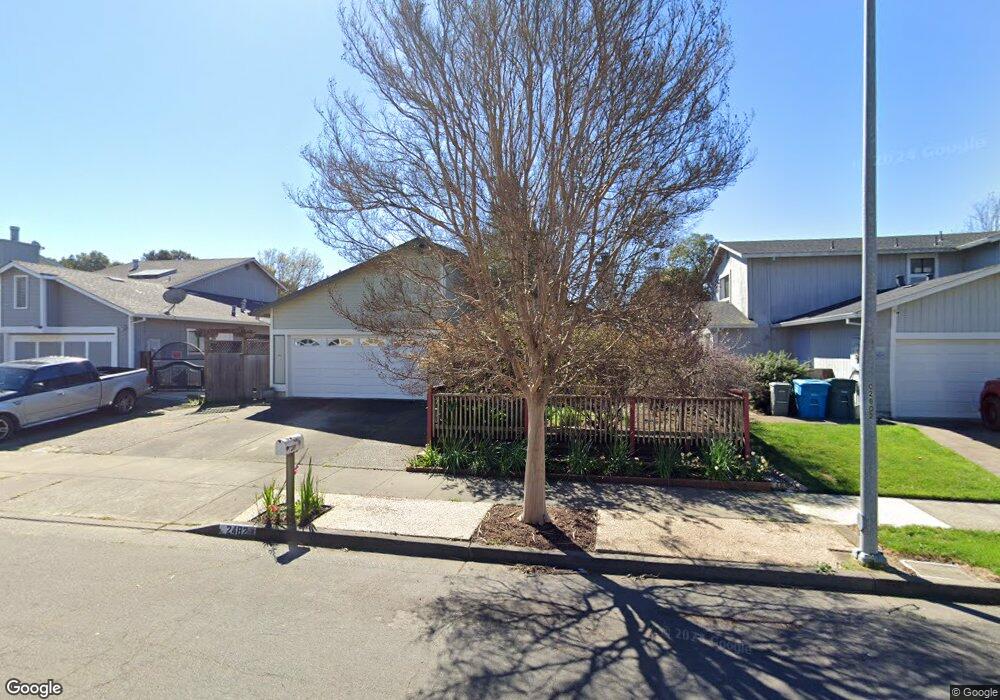
2482 Westpoint Place Santa Rosa, CA 95401
Northwest Santa Rosa NeighborhoodEstimated Value: $649,283 - $688,000
3
Beds
2
Baths
1,286
Sq Ft
$522/Sq Ft
Est. Value
About This Home
This home is located at 2482 Westpoint Place, Santa Rosa, CA 95401 and is currently estimated at $671,821, approximately $522 per square foot. 2482 Westpoint Place is a home located in Sonoma County with nearby schools including Albert F. Biella Elementary School, Hilliard Comstock Middle School, and Santa Rosa High School.
Ownership History
Date
Name
Owned For
Owner Type
Purchase Details
Closed on
Feb 17, 2022
Sold by
Dennis Anne N
Bought by
Anne N Dennis 2005 Trust
Current Estimated Value
Home Financials for this Owner
Home Financials are based on the most recent Mortgage that was taken out on this home.
Original Mortgage
$210,000
Outstanding Balance
$143,468
Interest Rate
3.69%
Mortgage Type
New Conventional
Estimated Equity
$528,353
Purchase Details
Closed on
Dec 22, 2005
Sold by
Dennis Anne N
Bought by
Dennis Anne N and Anne N Dennis 2005 Trust
Purchase Details
Closed on
Sep 6, 2001
Sold by
Fisher Carol B
Bought by
Dennis Anne N
Home Financials for this Owner
Home Financials are based on the most recent Mortgage that was taken out on this home.
Original Mortgage
$256,500
Interest Rate
7%
Purchase Details
Closed on
Feb 15, 1996
Sold by
Fisher Carol B
Bought by
Fisher Carol B
Home Financials for this Owner
Home Financials are based on the most recent Mortgage that was taken out on this home.
Original Mortgage
$130,000
Interest Rate
7.1%
Create a Home Valuation Report for This Property
The Home Valuation Report is an in-depth analysis detailing your home's value as well as a comparison with similar homes in the area
Home Values in the Area
Average Home Value in this Area
Purchase History
| Date | Buyer | Sale Price | Title Company |
|---|---|---|---|
| Anne N Dennis 2005 Trust | -- | Fidelity National Title | |
| Dennis Anne N | -- | Fidelity National Title | |
| Dennis Anne N | -- | None Available | |
| Dennis Anne N | $285,000 | Chicago Title Co | |
| Fisher Carol B | -- | North Bay Title Co |
Source: Public Records
Mortgage History
| Date | Status | Borrower | Loan Amount |
|---|---|---|---|
| Open | Dennis Anne N | $210,000 | |
| Previous Owner | Dennis Anne N | $256,500 | |
| Previous Owner | Fisher Carol B | $130,000 |
Source: Public Records
Tax History Compared to Growth
Tax History
| Year | Tax Paid | Tax Assessment Tax Assessment Total Assessment is a certain percentage of the fair market value that is determined by local assessors to be the total taxable value of land and additions on the property. | Land | Improvement |
|---|---|---|---|---|
| 2025 | $4,690 | $421,019 | $155,108 | $265,911 |
| 2024 | $4,690 | $412,765 | $152,067 | $260,698 |
| 2023 | $4,690 | $404,673 | $149,086 | $255,587 |
| 2022 | $4,329 | $396,739 | $146,163 | $250,576 |
| 2021 | $4,275 | $388,961 | $143,298 | $245,663 |
| 2020 | $4,265 | $384,974 | $141,829 | $243,145 |
| 2019 | $4,241 | $377,427 | $139,049 | $238,378 |
| 2018 | $4,216 | $370,027 | $136,323 | $233,704 |
| 2017 | $4,139 | $362,772 | $133,650 | $229,122 |
| 2016 | $4,106 | $355,660 | $131,030 | $224,630 |
| 2015 | $3,981 | $350,318 | $129,062 | $221,256 |
| 2014 | $2,972 | $274,000 | $101,000 | $173,000 |
Source: Public Records
Map
Nearby Homes
- 1532 Pinebrook Place
- 1380 Velma Ave
- 1507 Pinebrook Place
- 141 Stratford Way
- 2423 Guerneville Rd
- 66 Somerset Dr
- 2467 College Park Cir
- 2484 College Park Cir
- 2311 Guerneville Rd
- 1516 Wadsworth Ct
- 2318 S Hampton Cir
- 1569 Yardley St
- 1536 Claritin St
- 1540 Claritin St
- 1544 Claritin St
- 1545 Claritin St
- Plan 3 at Fox Meadow
- Plan 3X at Fox Meadow
- Plan 2 at Fox Meadow
- Plan 4 at Fox Meadow
- 2478 Westpoint Place
- 1398 Cadence Way
- 1394 Cadence Way
- 1390 Cadence Way
- 2450 Westpoint Place
- 2474 Westpoint Place
- 2454 Westpoint Place
- 2483 Westpoint Place
- 1386 Cadence Way
- 2487 Westpoint Place
- 2479 Westpoint Place
- 2446 Westpoint Place
- 2491 Westpoint Place
- 2475 Westpoint Place
- 1399 Cadence Way
- 1395 Cadence Way
- 2517 Doughty Way
- 1615 Pinebrook Place
- 1619 Pinebrook Place
- 2495 Westpoint Place