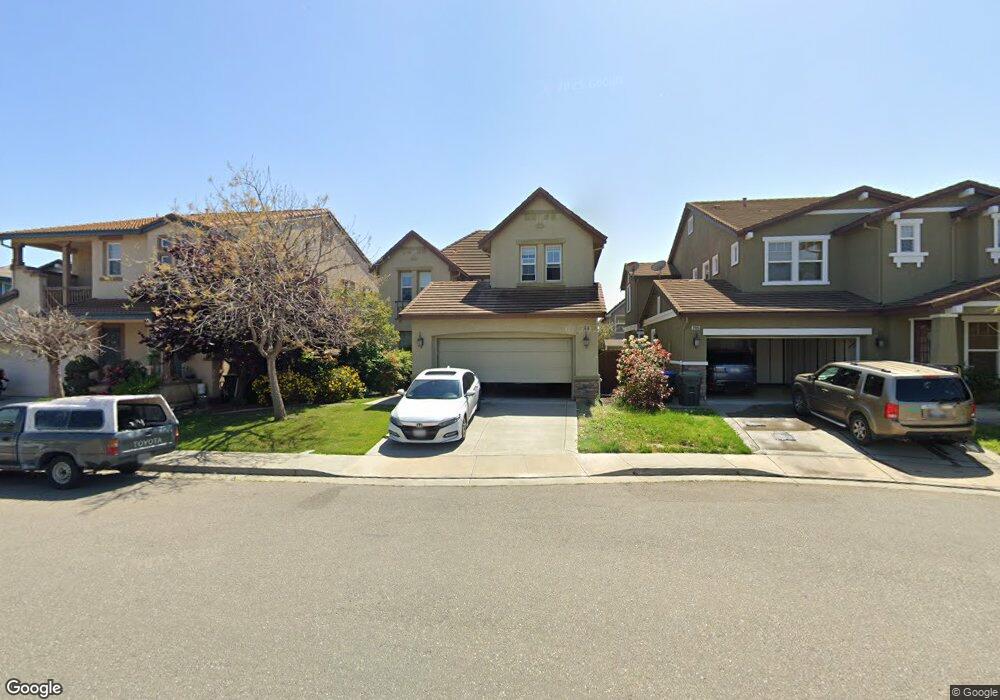
2489 Shorey Way Fairfield, CA 94533
Estimated Value: $623,931 - $686,000
4
Beds
3
Baths
2,304
Sq Ft
$285/Sq Ft
Est. Value
About This Home
This home is located at 2489 Shorey Way, Fairfield, CA 94533 and is currently estimated at $656,483, approximately $284 per square foot. 2489 Shorey Way is a home located in Solano County with nearby schools including Center Elementary School, Golden West Middle School, and Vanden High School.
Ownership History
Date
Name
Owned For
Owner Type
Purchase Details
Closed on
Nov 26, 2012
Sold by
Stout Peggy
Bought by
Shan Wenqian
Current Estimated Value
Home Financials for this Owner
Home Financials are based on the most recent Mortgage that was taken out on this home.
Original Mortgage
$195,600
Outstanding Balance
$132,287
Interest Rate
2.87%
Mortgage Type
New Conventional
Estimated Equity
$524,196
Purchase Details
Closed on
Nov 21, 2012
Sold by
Shen Chaopeng
Bought by
Shan Wenqian
Home Financials for this Owner
Home Financials are based on the most recent Mortgage that was taken out on this home.
Original Mortgage
$195,600
Outstanding Balance
$132,287
Interest Rate
2.87%
Mortgage Type
New Conventional
Estimated Equity
$524,196
Purchase Details
Closed on
Apr 21, 2012
Sold by
Stout Peggy
Bought by
Stout Peggy
Purchase Details
Closed on
Mar 3, 2008
Sold by
Western Pacific Housing Inc
Bought by
Stout Peggy
Create a Home Valuation Report for This Property
The Home Valuation Report is an in-depth analysis detailing your home's value as well as a comparison with similar homes in the area
Home Values in the Area
Average Home Value in this Area
Purchase History
| Date | Buyer | Sale Price | Title Company |
|---|---|---|---|
| Shan Wenqian | $326,000 | Old Republic Title Company | |
| Shan Wenqian | -- | Old Republic Title Company | |
| Stout Peggy | -- | None Available | |
| Stout Peggy | $400,000 | First American Title Company |
Source: Public Records
Mortgage History
| Date | Status | Borrower | Loan Amount |
|---|---|---|---|
| Open | Shan Wenqian | $195,600 |
Source: Public Records
Tax History Compared to Growth
Tax History
| Year | Tax Paid | Tax Assessment Tax Assessment Total Assessment is a certain percentage of the fair market value that is determined by local assessors to be the total taxable value of land and additions on the property. | Land | Improvement |
|---|---|---|---|---|
| 2025 | $6,211 | $401,432 | $92,351 | $309,081 |
| 2024 | $6,211 | $393,562 | $90,541 | $303,021 |
| 2023 | $6,146 | $385,846 | $88,766 | $297,080 |
| 2022 | $5,865 | $378,281 | $87,026 | $291,255 |
| 2021 | $5,782 | $370,865 | $85,320 | $285,545 |
| 2020 | $5,705 | $367,064 | $84,446 | $282,618 |
| 2019 | $5,605 | $359,868 | $82,791 | $277,077 |
| 2018 | $5,530 | $352,813 | $81,168 | $271,645 |
| 2017 | $5,377 | $345,896 | $79,577 | $266,319 |
| 2016 | $5,303 | $339,115 | $78,017 | $261,098 |
| 2015 | $5,223 | $334,023 | $76,846 | $257,177 |
| 2014 | $5,132 | $327,481 | $75,341 | $252,140 |
Source: Public Records
Map
Nearby Homes
- 2472 Shorey Way
- 5206 Conley Ln
- 2541 Rowe Dr
- 5277 Shumway Place
- 2438 Sheldon Dr
- 5291 Finkas Ln
- 5041 N Parr Ln
- 2433 Sanders Ln
- 2437 Sanders Ln
- 2326 Ray Venning Ct
- 5311 Gramercy Cir
- 5348 Gramercy Cir
- 5378 Discovery Way
- 2746 Gracie Place
- 5360 Discovery Way
- 5299 Elmquest Ct
- 5348 Discovery Way
- 5383 Elan Dr
- 6012 Big Sky Dr
- 6008 Big Sky Dr