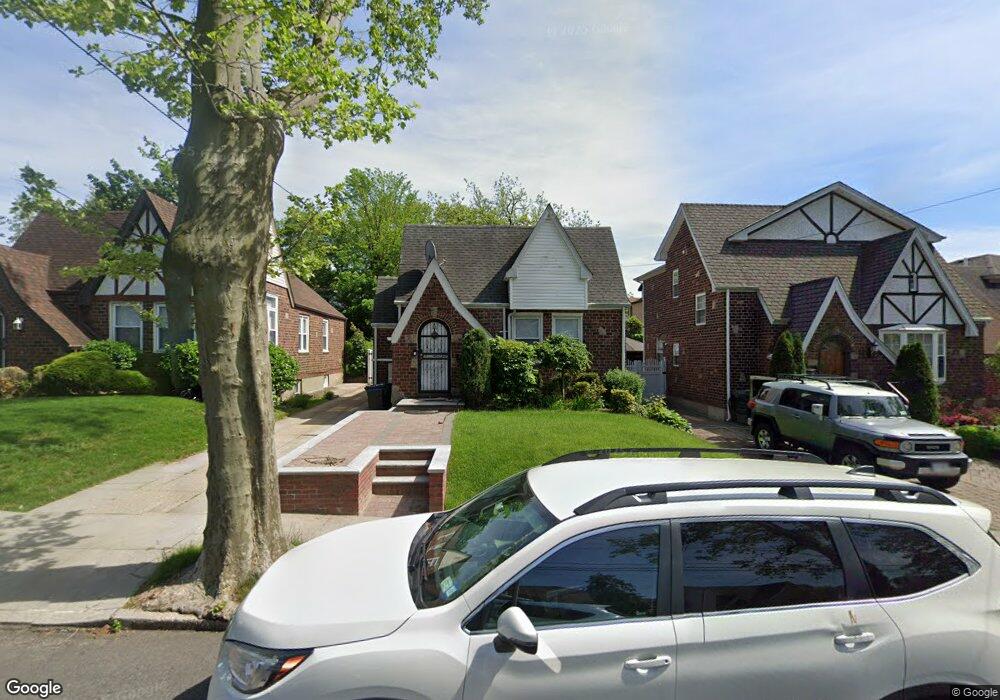
24924 Rushmore Terrace Little Neck, NY 11362
Little Neck NeighborhoodEstimated Value: $971,668 - $1,107,000
--
Bed
--
Bath
1,268
Sq Ft
$839/Sq Ft
Est. Value
About This Home
This home is located at 24924 Rushmore Terrace, Little Neck, NY 11362 and is currently estimated at $1,064,417, approximately $839 per square foot. 24924 Rushmore Terrace is a home located in Queens County with nearby schools including P.S. 94 - David D. Porter, Louis Pasteur Middle School 67, and Benjamin N Cardozo High School.
Ownership History
Date
Name
Owned For
Owner Type
Purchase Details
Closed on
Sep 20, 2019
Sold by
Kim Grace E and Yi Grace Eun
Bought by
Liu Thomas and Poon Kinning
Current Estimated Value
Home Financials for this Owner
Home Financials are based on the most recent Mortgage that was taken out on this home.
Original Mortgage
$774,400
Outstanding Balance
$678,314
Interest Rate
3.6%
Mortgage Type
Purchase Money Mortgage
Estimated Equity
$386,103
Purchase Details
Closed on
Jan 11, 2019
Sold by
Kim Mi Ja
Bought by
Yi Grace Eun and Yi James
Purchase Details
Closed on
Jul 25, 2013
Sold by
Kim Mi Ja and Yi Grace Eun
Bought by
Kim Mi Ja and Yi Grace Eun
Purchase Details
Closed on
Apr 12, 2012
Sold by
Kim Jin Tae and Kim Mi Ja
Bought by
Kim Jin Tae and Kim Mi Ja
Purchase Details
Closed on
Aug 7, 2008
Sold by
Kim Jin Tae and Kim Mi Ja
Bought by
Kim Jin Tae and Kim Mi Ja
Purchase Details
Closed on
Mar 28, 2008
Sold by
Lee Heejin and Lee Syung Ill
Bought by
Kim Jin Tae and Kim Mi Ja
Create a Home Valuation Report for This Property
The Home Valuation Report is an in-depth analysis detailing your home's value as well as a comparison with similar homes in the area
Home Values in the Area
Average Home Value in this Area
Purchase History
| Date | Buyer | Sale Price | Title Company |
|---|---|---|---|
| Liu Thomas | $968,000 | -- | |
| Yi Grace Eun | -- | -- | |
| Kim Mi Ja | -- | -- | |
| Kim Jin Tae | -- | -- | |
| Kim Jin Tae | -- | -- | |
| Kim Jin Tae | -- | -- |
Source: Public Records
Mortgage History
| Date | Status | Borrower | Loan Amount |
|---|---|---|---|
| Open | Liu Thomas | $774,400 |
Source: Public Records
Tax History Compared to Growth
Tax History
| Year | Tax Paid | Tax Assessment Tax Assessment Total Assessment is a certain percentage of the fair market value that is determined by local assessors to be the total taxable value of land and additions on the property. | Land | Improvement |
|---|---|---|---|---|
| 2025 | $7,685 | $39,196 | $9,704 | $29,492 |
| 2024 | $7,685 | $38,263 | $10,221 | $28,042 |
| 2023 | $7,254 | $36,116 | $8,809 | $27,307 |
| 2022 | $6,866 | $59,460 | $13,800 | $45,660 |
| 2021 | $6,876 | $50,340 | $13,800 | $36,540 |
| 2020 | $6,914 | $54,120 | $13,800 | $40,320 |
| 2019 | $6,670 | $51,120 | $13,800 | $37,320 |
| 2018 | $6,135 | $30,097 | $8,270 | $21,827 |
| 2017 | $5,843 | $28,663 | $7,081 | $21,582 |
| 2016 | $5,443 | $28,663 | $7,081 | $21,582 |
| 2015 | $3,261 | $27,219 | $9,506 | $17,713 |
| 2014 | $3,261 | $26,572 | $10,530 | $16,042 |
Source: Public Records
Map
Nearby Homes
- 24947 Rushmore Terrace
- 50-54 Deepdale Place
- 24854 Thebes Ave
- 50-43 Morenci Ln
- 5006 Marathon Pkwy
- 249-14 Cambria Ave
- 51-27 Browvale Ln
- 4529 Marathon Pkwy
- 252-25 Leith Rd
- 248-14 Deepdale Ave
- 45-26 Zion St
- 249-35 51st Ave
- 4521 248th St
- 25271 Brattle Ave
- 53-34 Browvale Ln
- 4817 Little Neck Pkwy
- 4934 Little Neck Pkwy
- 51-10 Little Neck Pkwy
- 4806 Glenwood St
- 47-27 Little Neck Pkwy Unit 4G
- 249-24 Rushmore Terrace
- 24920 Rushmore Terrace
- 24920 Rushmore Terrace
- 24928 Rushmore Terrace
- 249-32 Rushmore Terrace
- 24916 Rushmore Terrace
- 24932 Rushmore Terrace
- 5023 Morenci Ln
- 5019 Morenci Ln
- 5027 Morenci Ln
- 24912 Rushmore Terrace
- 24912 Rushmore Terrace
- 5015 Morenci Ln
- 5027 Morenci Ln
- 24940 Rushmore Terrace
- 249-31 Rushmore Terrace
- 50-15 Morenci Ln
- 5011 Morenci Ln
- 24923 Rushmore Terrace
- 24908 Rushmore Terrace