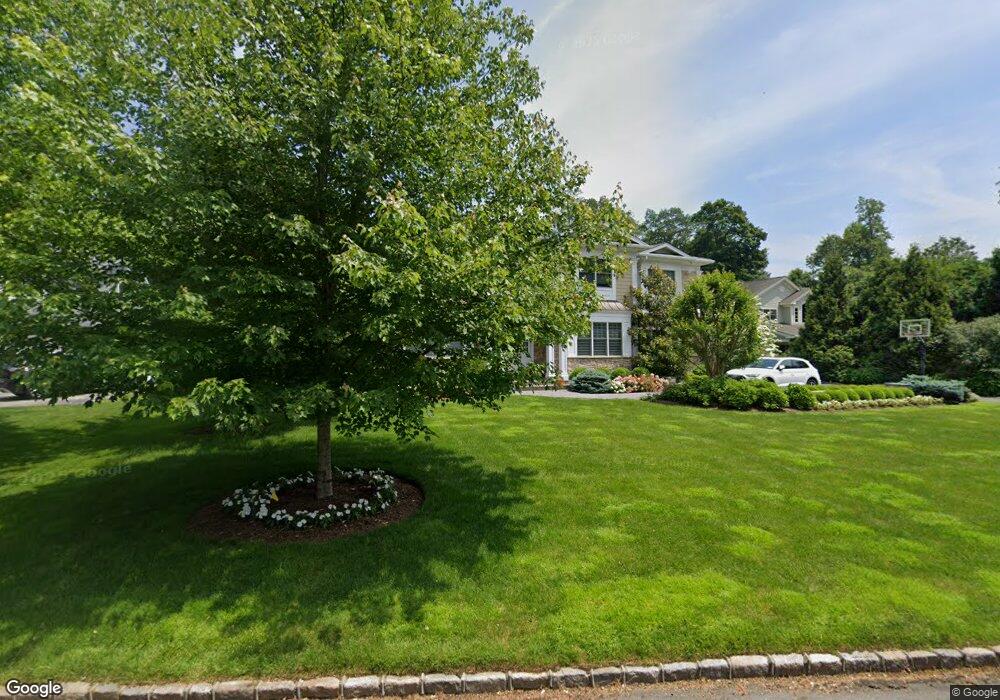
25 Crabapple Dr Roslyn, NY 11576
Estimated Value: $3,535,930
6
Beds
4
Baths
3,506
Sq Ft
$1,009/Sq Ft
Est. Value
About This Home
This home is located at 25 Crabapple Dr, Roslyn, NY 11576 and is currently estimated at $3,535,930, approximately $1,008 per square foot. 25 Crabapple Dr is a home located in Nassau County with nearby schools including Roslyn Middle School, Roslyn High School, and Green Vale School.
Ownership History
Date
Name
Owned For
Owner Type
Purchase Details
Closed on
Sep 13, 2016
Sold by
K & J Developers Llc
Bought by
Pnini Mark and Pnini Alison
Current Estimated Value
Home Financials for this Owner
Home Financials are based on the most recent Mortgage that was taken out on this home.
Original Mortgage
$2,100,000
Outstanding Balance
$1,657,478
Interest Rate
3.15%
Mortgage Type
Adjustable Rate Mortgage/ARM
Estimated Equity
$1,878,452
Purchase Details
Closed on
Jul 15, 2014
Sold by
Malekan Kourosh
Bought by
K And J Developers Llc
Purchase Details
Closed on
May 23, 2014
Sold by
Chapman Brent and Chapman Robin
Bought by
Malekan Kourosh
Purchase Details
Closed on
Nov 14, 2006
Sold by
Lewis Marilyn
Create a Home Valuation Report for This Property
The Home Valuation Report is an in-depth analysis detailing your home's value as well as a comparison with similar homes in the area
Home Values in the Area
Average Home Value in this Area
Purchase History
| Date | Buyer | Sale Price | Title Company |
|---|---|---|---|
| Pnini Mark | $3,400,000 | Mid Atlantic Abstract Corp | |
| Pnini Mark | $3,400,000 | Mid Atlantic Abstract Corp | |
| Pnini Mark | $3,400,000 | Mid Atlantic Abstract Corp | |
| K And J Developers Llc | -- | -- | |
| K And J Developers Llc | -- | -- | |
| Malekan Kourosh | $1,300,000 | The Judicial Title Insurance | |
| Malekan Kourosh | $1,300,000 | The Judicial Title Insurance | |
| -- | $900,000 | -- | |
| -- | $900,000 | -- |
Source: Public Records
Mortgage History
| Date | Status | Borrower | Loan Amount |
|---|---|---|---|
| Open | Pnini Mark | $2,100,000 | |
| Closed | Pnini Mark | $2,100,000 |
Source: Public Records
Tax History Compared to Growth
Tax History
| Year | Tax Paid | Tax Assessment Tax Assessment Total Assessment is a certain percentage of the fair market value that is determined by local assessors to be the total taxable value of land and additions on the property. | Land | Improvement |
|---|---|---|---|---|
| 2025 | $44,656 | $2,039 | $525 | $1,514 |
| 2024 | $8,468 | $2,160 | $556 | $1,604 |
| 2023 | $48,164 | $2,370 | $610 | $1,760 |
| 2022 | $48,164 | $2,513 | $647 | $1,866 |
| 2021 | $50,414 | $2,443 | $559 | $1,884 |
| 2020 | $49,903 | $4,480 | $1,334 | $3,146 |
| 2019 | $61,360 | $5,475 | $1,631 | $3,844 |
| 2018 | $71,500 | $3,218 | $0 | $0 |
| 2017 | $21,960 | $2,210 | $1,619 | $591 |
| 2016 | $27,033 | $2,372 | $1,738 | $634 |
| 2015 | $5,146 | $2,372 | $1,738 | $634 |
| 2014 | $5,146 | $2,372 | $1,738 | $634 |
| 2013 | $5,024 | $2,372 | $1,738 | $634 |
Source: Public Records
Map
Nearby Homes
- 15 Cedar Dr
- 80 Walnut Dr
- 47 Pinewood Rd
- 47 Midwood Cross
- 6 Stable Ln
- 10 Vanad Dr
- 150 Hummingbird Dr
- 8 Stable Ln
- 330 Chestnut Dr
- 11 Spring Hill Ln
- 75 Chestnut Dr
- 14 Lakeville Dr
- 95 Oakdale Ln
- 57 Red Ground Rd
- 39 Squirrel Hill Rd
- 110 Peach Dr
- 9 Circle Ln
- 39 Hummingbird Dr
- 6 Spring Hill Ln
- 12 Spring Hill Ln