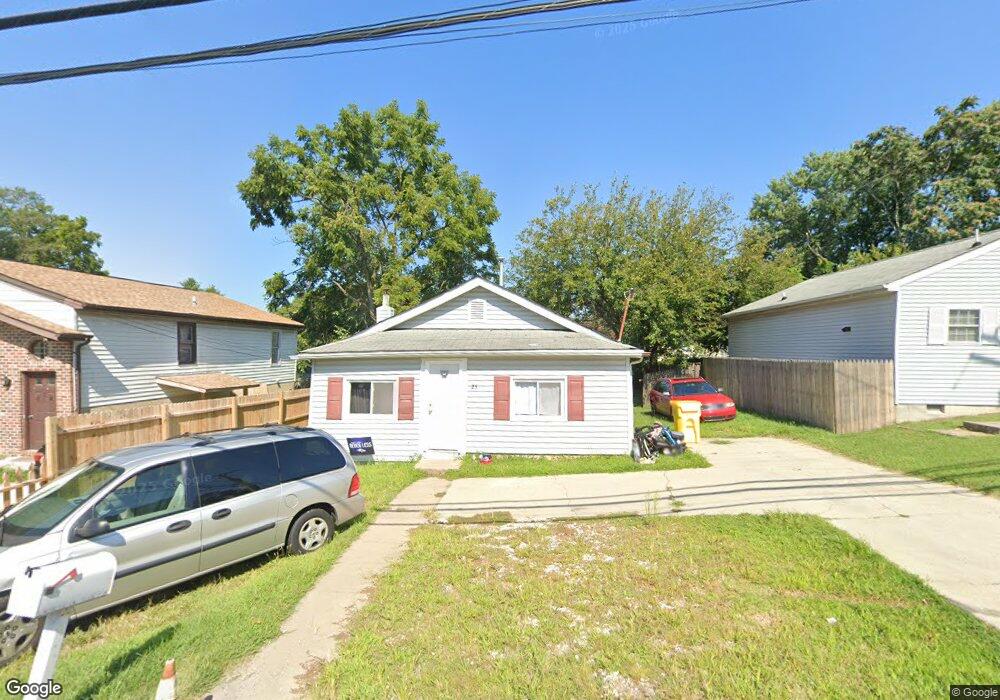
25 Marley Neck Rd Glen Burnie, MD 21060
Estimated Value: $245,000 - $330,000
3
Beds
1
Bath
908
Sq Ft
$314/Sq Ft
Est. Value
About This Home
This home is located at 25 Marley Neck Rd, Glen Burnie, MD 21060 and is currently estimated at $285,418, approximately $314 per square foot. 25 Marley Neck Rd is a home located in Anne Arundel County with nearby schools including Marley Elementary School, Marley Middle School, and Glen Burnie High School.
Ownership History
Date
Name
Owned For
Owner Type
Purchase Details
Closed on
Jan 26, 2010
Sold by
Hsbc Bank Usa National Assoc
Bought by
Castello Augusto and Mahaffey Redge
Current Estimated Value
Purchase Details
Closed on
Jun 25, 2009
Sold by
Olugbade Lawrence
Bought by
Hsbc Bank Usa National Assoc
Purchase Details
Closed on
Jun 14, 2005
Sold by
Irwin Union Bank & Trust Co
Bought by
Olugbade Lawrence
Home Financials for this Owner
Home Financials are based on the most recent Mortgage that was taken out on this home.
Original Mortgage
$125,910
Interest Rate
8.4%
Mortgage Type
Adjustable Rate Mortgage/ARM
Purchase Details
Closed on
Nov 18, 2004
Sold by
Belcher William E
Bought by
Irwin Union Bank And Trust Company
Purchase Details
Closed on
Aug 18, 1998
Sold by
The Secretary Of Housing
Bought by
Belcher William E and Belcher Brenda R
Purchase Details
Closed on
Feb 5, 1998
Sold by
Almes Troy
Bought by
The Secretary Of Housing
Create a Home Valuation Report for This Property
The Home Valuation Report is an in-depth analysis detailing your home's value as well as a comparison with similar homes in the area
Home Values in the Area
Average Home Value in this Area
Purchase History
| Date | Buyer | Sale Price | Title Company |
|---|---|---|---|
| Castello Augusto | $70,000 | -- | |
| Hsbc Bank Usa National Assoc | $144,000 | -- | |
| Olugbade Lawrence | $139,900 | -- | |
| Irwin Union Bank And Trust Company | $90,000 | -- | |
| Belcher William E | $58,251 | -- | |
| The Secretary Of Housing | $63,980 | -- |
Source: Public Records
Mortgage History
| Date | Status | Borrower | Loan Amount |
|---|---|---|---|
| Previous Owner | Olugbade Lawrence | $125,910 | |
| Closed | Belcher William E | -- |
Source: Public Records
Tax History Compared to Growth
Tax History
| Year | Tax Paid | Tax Assessment Tax Assessment Total Assessment is a certain percentage of the fair market value that is determined by local assessors to be the total taxable value of land and additions on the property. | Land | Improvement |
|---|---|---|---|---|
| 2025 | $2,554 | $198,700 | $142,600 | $56,100 |
| 2024 | $2,554 | $187,400 | $0 | $0 |
| 2023 | $2,397 | $176,100 | $0 | $0 |
| 2022 | $2,152 | $164,800 | $122,600 | $42,200 |
| 2021 | $0 | $162,967 | $0 | $0 |
| 2020 | $2,073 | $161,133 | $0 | $0 |
| 2019 | $2,055 | $159,300 | $122,600 | $36,700 |
| 2018 | $1,508 | $148,733 | $0 | $0 |
| 2017 | $1,791 | $138,167 | $0 | $0 |
| 2016 | -- | $127,600 | $0 | $0 |
| 2015 | -- | $121,433 | $0 | $0 |
| 2014 | -- | $115,267 | $0 | $0 |
Source: Public Records
Map
Nearby Homes
- 8 Marley Neck Rd
- 7626 3rd Ave
- 118 Mcguirk Dr
- 32 1st Ave
- 7739 Overhill Rd
- 7644 Spencer Rd
- 400 Summit Ave
- 15 Beach Rd
- 510 Creek Crossing Ln
- 105 Sanderling Ct
- 98 Forest Rd
- 1 Beach Rd
- 0 Bertram Ave Unit MDAA2112598
- 1252 Barkleyridge Ln
- 6828 Winterhill Ln
- 6824 Winterhill Ln
- 1244 Barkleyridge Ln
- 1240 Barkleyridge Ln
- 7677 Mueller Dr
- 225 Shana Rd
- 27B Marley Neck Rd
- 27A Marley Neck Rd
- 27 Marley Neck Rd
- 23 Marley Neck Rd
- 21 Marley Neck Rd
- 18 Marley Neck Rd
- 26 Queen Anne Rd
- 26A Queen Anne Rd
- 29 Marley Neck Rd
- 24 Queen Anne Rd
- 28 Queen Anne Rd
- 19 Marley Neck Rd
- 14 Marley Neck Rd
- 30 Queen Anne Rd
- 8 Queen Anne Rd
- 18 Queen Anne Rd
- 7698 Overhill Rd
- 17 Marley Neck Rd
- 101 Marley Neck Rd
- 7700 Overhill Rd