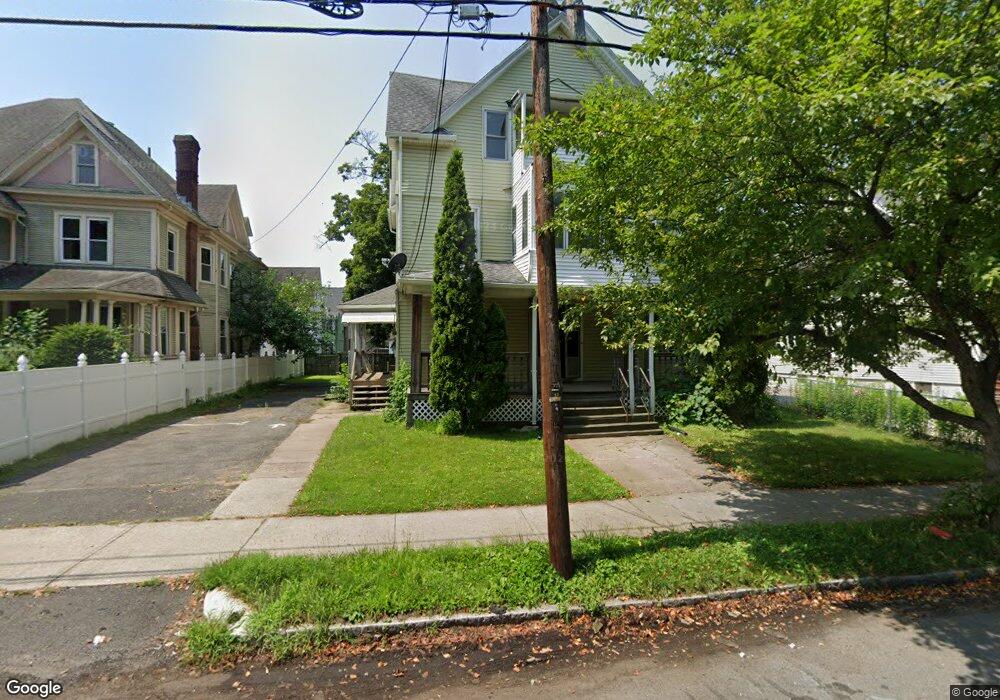
250 Main St West Springfield, MA 01089
Estimated Value: $341,000 - $384,000
5
Beds
3
Baths
2,660
Sq Ft
$138/Sq Ft
Est. Value
About This Home
This home is located at 250 Main St, West Springfield, MA 01089 and is currently estimated at $366,805, approximately $137 per square foot. 250 Main St is a home located in Hampden County with nearby schools including Hampden Charter School of Science West.
Ownership History
Date
Name
Owned For
Owner Type
Purchase Details
Closed on
Nov 8, 2023
Sold by
Pham Cam M and Td Bank Na
Bought by
Td Bank
Current Estimated Value
Purchase Details
Closed on
Jul 16, 2007
Sold by
Pham Cam Minh and Phan Vuong Phan
Bought by
Pham Cam Minh
Home Financials for this Owner
Home Financials are based on the most recent Mortgage that was taken out on this home.
Original Mortgage
$100,000
Interest Rate
6.48%
Mortgage Type
Purchase Money Mortgage
Create a Home Valuation Report for This Property
The Home Valuation Report is an in-depth analysis detailing your home's value as well as a comparison with similar homes in the area
Home Values in the Area
Average Home Value in this Area
Purchase History
| Date | Buyer | Sale Price | Title Company |
|---|---|---|---|
| Td Bank | $243,078 | None Available | |
| Pham Cam Minh | -- | -- |
Source: Public Records
Mortgage History
| Date | Status | Borrower | Loan Amount |
|---|---|---|---|
| Previous Owner | Pham Cam Minh | $100,000 |
Source: Public Records
Tax History Compared to Growth
Tax History
| Year | Tax Paid | Tax Assessment Tax Assessment Total Assessment is a certain percentage of the fair market value that is determined by local assessors to be the total taxable value of land and additions on the property. | Land | Improvement |
|---|---|---|---|---|
| 2025 | $4,254 | $286,100 | $85,500 | $200,600 |
| 2024 | $4,237 | $286,100 | $85,500 | $200,600 |
| 2023 | $3,821 | $245,900 | $85,500 | $160,400 |
| 2022 | $4,102 | $260,300 | $77,600 | $182,700 |
| 2021 | $3,375 | $199,700 | $62,300 | $137,400 |
| 2020 | $3,388 | $199,400 | $62,300 | $137,100 |
| 2019 | $3,382 | $199,400 | $62,300 | $137,100 |
| 2018 | $3,400 | $199,400 | $62,300 | $137,100 |
| 2017 | $3,400 | $199,400 | $62,300 | $137,100 |
| 2016 | $3,347 | $197,000 | $59,900 | $137,100 |
| 2015 | $3,177 | $187,000 | $58,700 | $128,300 |
| 2014 | $3,069 | $187,000 | $58,700 | $128,300 |
Source: Public Records
Map
Nearby Homes