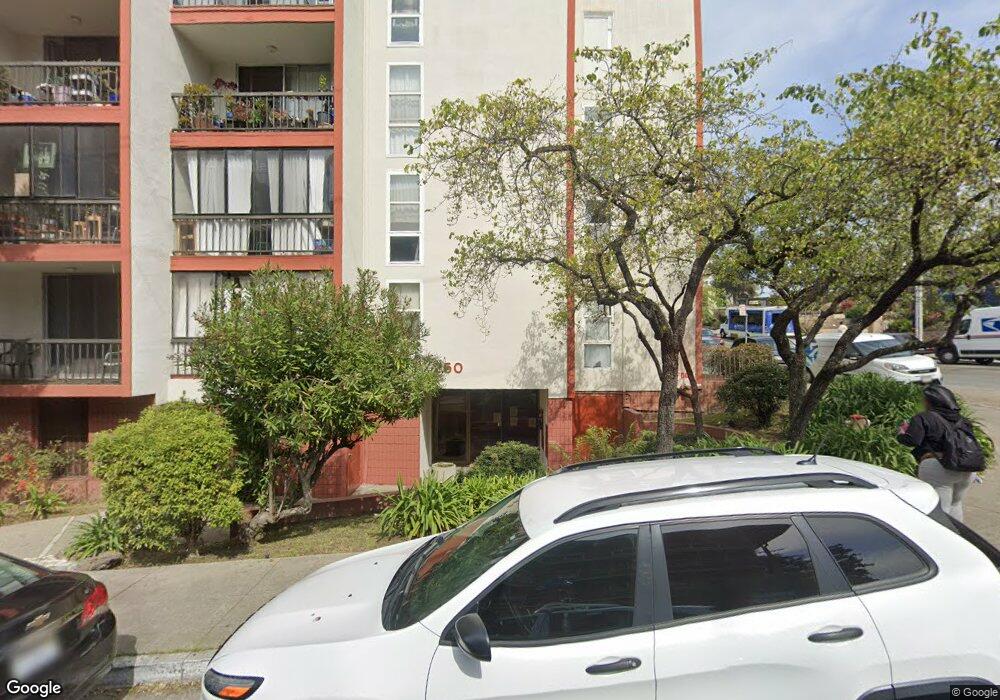
250 Whitmore St Unit 309 Oakland, CA 94611
Piedmont Avenue NeighborhoodEstimated Value: $454,000 - $695,000
2
Beds
2
Baths
913
Sq Ft
$586/Sq Ft
Est. Value
About This Home
This home is located at 250 Whitmore St Unit 309, Oakland, CA 94611 and is currently estimated at $535,296, approximately $586 per square foot. 250 Whitmore St Unit 309 is a home located in Alameda County with nearby schools including Piedmont Avenue Elementary School, Westlake Middle School, and Oakland Technical High School.
Ownership History
Date
Name
Owned For
Owner Type
Purchase Details
Closed on
Oct 3, 2017
Sold by
Singh Maneesh Gogia
Bought by
Singh Dalbir
Current Estimated Value
Home Financials for this Owner
Home Financials are based on the most recent Mortgage that was taken out on this home.
Original Mortgage
$522,000
Outstanding Balance
$462,413
Interest Rate
6.37%
Mortgage Type
New Conventional
Estimated Equity
$72,883
Purchase Details
Closed on
Sep 27, 2017
Sold by
Singh Dalbir and Agrawal Anant
Bought by
Lamusao Maynard
Home Financials for this Owner
Home Financials are based on the most recent Mortgage that was taken out on this home.
Original Mortgage
$522,000
Outstanding Balance
$462,413
Interest Rate
6.37%
Mortgage Type
New Conventional
Estimated Equity
$72,883
Purchase Details
Closed on
Jun 16, 2005
Sold by
Singh Dalbir and Agarwal Anant
Bought by
Singh Dalbir
Home Financials for this Owner
Home Financials are based on the most recent Mortgage that was taken out on this home.
Original Mortgage
$25,000
Interest Rate
5.72%
Mortgage Type
Credit Line Revolving
Purchase Details
Closed on
Jan 20, 2005
Sold by
Deslonde James
Bought by
Singh Dalbir and Agrawal Anant
Home Financials for this Owner
Home Financials are based on the most recent Mortgage that was taken out on this home.
Original Mortgage
$288,000
Interest Rate
5.37%
Mortgage Type
Purchase Money Mortgage
Purchase Details
Closed on
Aug 2, 2001
Sold by
Henderson Phillip E
Bought by
Deslonde James
Home Financials for this Owner
Home Financials are based on the most recent Mortgage that was taken out on this home.
Original Mortgage
$250,000
Interest Rate
7.1%
Mortgage Type
Purchase Money Mortgage
Purchase Details
Closed on
Apr 23, 1998
Sold by
Tukovits Richard J Trust
Bought by
Henderson Phillip E
Home Financials for this Owner
Home Financials are based on the most recent Mortgage that was taken out on this home.
Original Mortgage
$88,000
Interest Rate
7.06%
Mortgage Type
Purchase Money Mortgage
Purchase Details
Closed on
Nov 12, 1997
Sold by
Tukovits Richard J
Bought by
Tukovits Richard J and Briganti John F
Purchase Details
Closed on
Dec 17, 1993
Sold by
Gadsby George C and Gadsby Margaret A
Bought by
Tukovits Richard John
Home Financials for this Owner
Home Financials are based on the most recent Mortgage that was taken out on this home.
Original Mortgage
$91,500
Interest Rate
7.2%
Mortgage Type
Purchase Money Mortgage
Create a Home Valuation Report for This Property
The Home Valuation Report is an in-depth analysis detailing your home's value as well as a comparison with similar homes in the area
Home Values in the Area
Average Home Value in this Area
Purchase History
| Date | Buyer | Sale Price | Title Company |
|---|---|---|---|
| Singh Dalbir | -- | Old Republic Title Company | |
| Lamusao Maynard | $580,000 | Old Republic Title Company | |
| Agrawal Anant | -- | Old Republic Title Company | |
| Singh Dalbir | $25,000 | First American Title Ins Co | |
| Singh Dalbir | $360,000 | -- | |
| Deslonde James | $250,000 | Fidelity National Title Co | |
| Henderson Phillip E | $110,000 | First American Title Guarant | |
| Tukovits Richard J | -- | -- | |
| Tukovits Richard John | $102,000 | First American Title Guarant |
Source: Public Records
Mortgage History
| Date | Status | Borrower | Loan Amount |
|---|---|---|---|
| Open | Lamusao Maynard | $522,000 | |
| Previous Owner | Singh Dalbir | $25,000 | |
| Previous Owner | Singh Dalbir | $288,000 | |
| Previous Owner | Deslonde James | $250,000 | |
| Previous Owner | Henderson Phillip E | $88,000 | |
| Previous Owner | Tukovits Richard John | $91,500 | |
| Closed | Singh Dalbir | $54,000 |
Source: Public Records
Tax History Compared to Growth
Tax History
| Year | Tax Paid | Tax Assessment Tax Assessment Total Assessment is a certain percentage of the fair market value that is determined by local assessors to be the total taxable value of land and additions on the property. | Land | Improvement |
|---|---|---|---|---|
| 2025 | $9,965 | $659,928 | $197,978 | $461,950 |
| 2024 | $9,965 | $646,990 | $194,097 | $452,893 |
| 2023 | $10,464 | $634,304 | $190,291 | $444,013 |
| 2022 | $10,194 | $621,870 | $186,561 | $435,309 |
| 2021 | $9,757 | $609,678 | $182,903 | $426,775 |
| 2020 | $9,650 | $603,431 | $181,029 | $422,402 |
| 2019 | $9,294 | $591,600 | $177,480 | $414,120 |
| 2018 | $9,102 | $580,000 | $174,000 | $406,000 |
| 2017 | $6,905 | $438,357 | $131,507 | $306,850 |
| 2016 | $6,654 | $429,764 | $128,929 | $300,835 |
| 2015 | $6,618 | $423,311 | $126,993 | $296,318 |
| 2014 | $4,734 | $280,000 | $84,000 | $196,000 |
Source: Public Records
Map
Nearby Homes
- 250 Whitmore St Unit 205
- 2005 Pleasant Valley Ave Unit 316
- 288 Whitmore St Unit 310B
- 288 Whitmore St Unit 217B
- 288 Whitmore St Unit 125B
- 288 Whitmore St Unit 215
- 288 Whitmore St Unit 220
- 4267 Montgomery St
- 4343 Howe St
- 4215 Terrace St
- 4949 Coronado Ave
- 4440 Howe St
- 4395 Piedmont Ave Unit P208
- 159 John St
- 192 Ridgeway Ave
- 350 51st St
- 4170 Emerald St Unit 4
- 5271 Broadway Terrace Unit 1
- 57 Entrada Ave
- 250 Whitmore St Unit 210
- 250 Whitmore St
- 250 Whitmore St Unit 117 - 117
- 250 Whitmore St Unit 102
- 250 Whitmore St Unit 316
- 250 Whitmore St Unit 111
- 250 Whitmore St Unit 114
- 250 Whitmore St Unit 207
- 250 Whitmore St Unit 215
- 250 Whitmore St Unit 401
- 250 Whitmore St Unit 302
- 250 Whitmore St Unit 105
- 250 Whitmore St Unit 208
- 250 Whitmore St Unit 304
- 250 Whitmore St
- 250 Whitmore St Unit 216
- 250 Whitmore St Unit 311
- 250 Whitmore St Unit 314
- 250 Whitmore St Unit 313
- 250 Whitmore St Unit 101