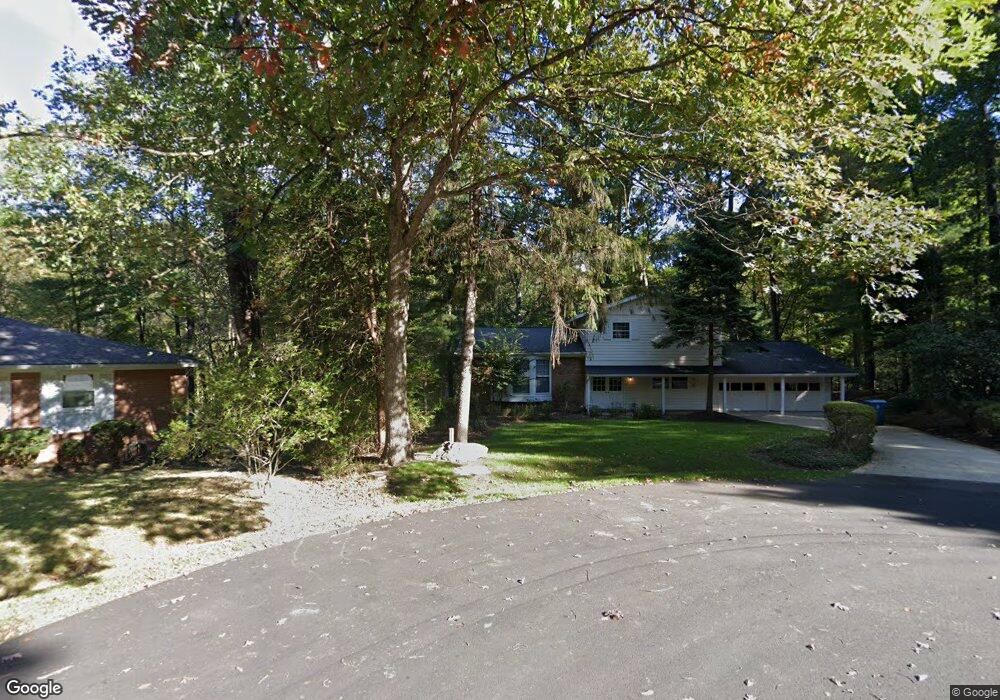
2500 Fowlers Ln Reston, VA 20191
Estimated Value: $917,436 - $994,000
4
Beds
3
Baths
1,914
Sq Ft
$498/Sq Ft
Est. Value
About This Home
This home is located at 2500 Fowlers Ln, Reston, VA 20191 and is currently estimated at $953,859, approximately $498 per square foot. 2500 Fowlers Ln is a home located in Fairfax County with nearby schools including Hunters Woods Elementary, South Lakes High School, and Edlin School.
Ownership History
Date
Name
Owned For
Owner Type
Purchase Details
Closed on
Jul 17, 2019
Sold by
Hayes Margaret E and Hayes Margaret Elizabeth
Bought by
Hayes Margaret Elizabeth and Hayes Family Trust
Current Estimated Value
Purchase Details
Closed on
Dec 31, 1998
Sold by
Pogue Michael
Bought by
Hayes Joseph P
Home Financials for this Owner
Home Financials are based on the most recent Mortgage that was taken out on this home.
Original Mortgage
$150,000
Outstanding Balance
$34,911
Interest Rate
6.8%
Estimated Equity
$918,948
Purchase Details
Closed on
Feb 1, 1994
Sold by
Mathew D
Bought by
Pogue David M
Home Financials for this Owner
Home Financials are based on the most recent Mortgage that was taken out on this home.
Original Mortgage
$231,300
Interest Rate
7.11%
Create a Home Valuation Report for This Property
The Home Valuation Report is an in-depth analysis detailing your home's value as well as a comparison with similar homes in the area
Home Values in the Area
Average Home Value in this Area
Purchase History
| Date | Buyer | Sale Price | Title Company |
|---|---|---|---|
| Hayes Margaret Elizabeth | -- | None Available | |
| Hayes Joseph P | $375,000 | -- | |
| Pogue David M | $257,000 | -- |
Source: Public Records
Mortgage History
| Date | Status | Borrower | Loan Amount |
|---|---|---|---|
| Open | Hayes Joseph P | $150,000 | |
| Previous Owner | Pogue David M | $231,300 |
Source: Public Records
Tax History Compared to Growth
Tax History
| Year | Tax Paid | Tax Assessment Tax Assessment Total Assessment is a certain percentage of the fair market value that is determined by local assessors to be the total taxable value of land and additions on the property. | Land | Improvement |
|---|---|---|---|---|
| 2025 | $9,045 | $807,690 | $324,000 | $483,690 |
| 2024 | $9,045 | $750,280 | $304,000 | $446,280 |
| 2023 | $8,595 | $731,160 | $304,000 | $427,160 |
| 2022 | $8,250 | $692,990 | $274,000 | $418,990 |
| 2021 | $8,101 | $663,780 | $254,000 | $409,780 |
| 2020 | $7,811 | $634,750 | $239,000 | $395,750 |
| 2019 | $7,313 | $594,300 | $229,000 | $365,300 |
| 2018 | $6,662 | $579,300 | $214,000 | $365,300 |
| 2017 | $6,998 | $579,300 | $214,000 | $365,300 |
| 2016 | $6,777 | $562,140 | $204,000 | $358,140 |
| 2015 | $6,538 | $562,140 | $204,000 | $358,140 |
| 2014 | $6,524 | $562,140 | $204,000 | $358,140 |
Source: Public Records
Map
Nearby Homes
- 11813 Triple Crown Rd
- 2376 Generation Dr
- 11690 Generation Ct
- 11751 Mossy Creek Ln
- 2369 Generation Dr
- 11837 Shire Ct Unit 22C
- 11841 Shire Ct Unit 31D
- 2300 Horseferry Ct
- 2318 Millennium Ln
- 2369 Old Trail Dr
- 11813 Breton Ct Unit 1A
- 11808 Breton Ct Unit 12C
- 11824 Breton Ct Unit 24A
- 11709 Karbon Hill Ct Unit 606A
- 11659 Stoneview Square Unit 99/1B
- 11657 Stoneview Square Unit 97/22C
- 2418 Ridgehampton Ct
- 2233 Lovedale Ln Unit I
- 11721 Karbon Hill Ct Unit T2
- 11908 Barrel Cooper Ct
- 2501 Fowlers Ln
- 2502 Fowlers Ln
- 2503 Fowlers Ln
- 2504 Fowlers Ln
- 2505 Fowlers Ln
- 2506 Fowlers Ln
- 2429 Silver Fox Ln
- 2428 Silver Fox Ln
- 2511 Fowlers Ln
- 2508 Fowlers Ln
- 2427 Silver Fox Ln
- 2426 Silver Fox Ln
- 2513 Fowlers Ln
- 12002 Whip Rd
- 11925 Triple Crown Rd
- 2424 Silver Fox Ln
- 12001 Whip Rd
- 2425 Silver Fox Ln
- 2515 Fowlers Ln
- 11927 Triple Crown Rd