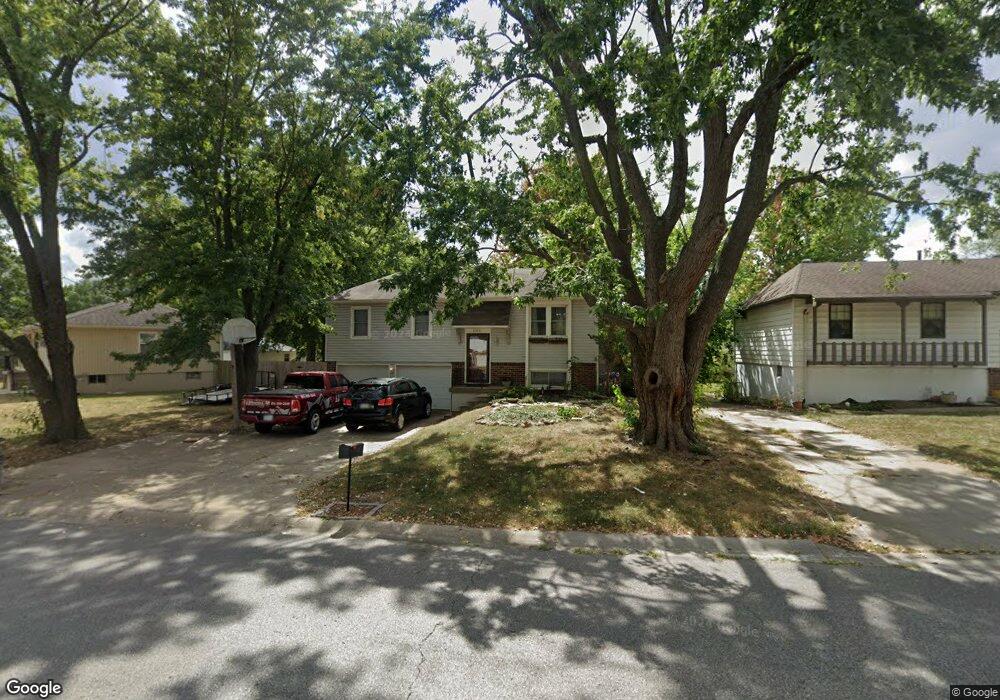
2500 NW Kingsridge Dr Blue Springs, MO 64015
Estimated Value: $216,487 - $236,000
3
Beds
2
Baths
988
Sq Ft
$231/Sq Ft
Est. Value
About This Home
This home is located at 2500 NW Kingsridge Dr, Blue Springs, MO 64015 and is currently estimated at $228,122, approximately $230 per square foot. 2500 NW Kingsridge Dr is a home located in Jackson County with nearby schools including James Lewis Elementary School, Brittany Hill Middle School, and Blue Springs High School.
Ownership History
Date
Name
Owned For
Owner Type
Purchase Details
Closed on
Nov 21, 2008
Sold by
Sennott James R and Sennott Mary S
Bought by
2003 Properties Llc
Current Estimated Value
Purchase Details
Closed on
Mar 24, 2004
Sold by
Brown Deborah S
Bought by
Sennott James R and Sennott Mary S
Home Financials for this Owner
Home Financials are based on the most recent Mortgage that was taken out on this home.
Original Mortgage
$97,850
Interest Rate
5%
Mortgage Type
Purchase Money Mortgage
Purchase Details
Closed on
Nov 10, 1997
Sold by
Green Deborah S and Green Deborah S
Bought by
Brown Deborah S
Home Financials for this Owner
Home Financials are based on the most recent Mortgage that was taken out on this home.
Original Mortgage
$60,350
Interest Rate
6.85%
Mortgage Type
Purchase Money Mortgage
Purchase Details
Closed on
Oct 21, 1997
Sold by
Kevin Green Thomas
Bought by
Brown Deborah S and Green Deborah S
Home Financials for this Owner
Home Financials are based on the most recent Mortgage that was taken out on this home.
Original Mortgage
$60,350
Interest Rate
6.85%
Mortgage Type
Purchase Money Mortgage
Create a Home Valuation Report for This Property
The Home Valuation Report is an in-depth analysis detailing your home's value as well as a comparison with similar homes in the area
Home Values in the Area
Average Home Value in this Area
Purchase History
| Date | Buyer | Sale Price | Title Company |
|---|---|---|---|
| 2003 Properties Llc | -- | None Available | |
| Sennott James R | -- | Stewart Title | |
| Brown Deborah S | -- | -- | |
| Brown Deborah S | -- | -- |
Source: Public Records
Mortgage History
| Date | Status | Borrower | Loan Amount |
|---|---|---|---|
| Previous Owner | Sennott James R | $97,850 | |
| Previous Owner | Brown Deborah S | $60,350 | |
| Closed | Brown Deborah S | $22,500 |
Source: Public Records
Tax History Compared to Growth
Tax History
| Year | Tax Paid | Tax Assessment Tax Assessment Total Assessment is a certain percentage of the fair market value that is determined by local assessors to be the total taxable value of land and additions on the property. | Land | Improvement |
|---|---|---|---|---|
| 2025 | $2,647 | $31,660 | $6,107 | $25,553 |
| 2024 | $2,597 | $32,450 | $4,507 | $27,943 |
| 2023 | $2,597 | $32,450 | $4,062 | $28,388 |
| 2022 | $2,167 | $23,940 | $3,619 | $20,321 |
| 2021 | $2,165 | $23,940 | $3,619 | $20,321 |
| 2020 | $1,941 | $21,833 | $3,619 | $18,214 |
| 2019 | $1,877 | $21,833 | $3,619 | $18,214 |
| 2018 | $1,697 | $19,001 | $3,149 | $15,852 |
| 2017 | $1,650 | $19,001 | $3,149 | $15,852 |
| 2016 | $1,650 | $18,525 | $2,983 | $15,542 |
| 2014 | $1,679 | $18,786 | $2,780 | $16,006 |
Source: Public Records
Map
Nearby Homes
- 913 NW Camelot Ct
- 2317 NW Kensington Ct
- 2508 NW Castle Dr
- 2804 NW Kingsridge Dr
- 1029 NW Berkshire Dr
- 2916 NW Chelsea Place
- 516 NW Mill Ct
- 3212 NW Canterbury Rd
- 3213 NW Canterbury Place
- 1389 NW Jefferson Ct
- 1618 NW Samantha Ct
- 1400 NW Deer Run Trail
- 305 NW 17th St
- 124 SW 27th St
- 1604 NW Sunridge Dr
- 503 NW 15th St
- 216 SW 26th St
- 1501 NW 18th St
- 1109 NW Mock Ave
- 2000 SW Smith St
- 2504 NW Kingsridge Dr
- 909 NW Castle Dr
- 905 NW Castle Dr
- 2508 NW Kingsridge Dr
- 2425 NW Kingsridge Dr
- 2501 NW Camelot Place
- 2421 NW Camelot Place
- 2505 NW Camelot Place
- 2512 NW Kingsridge Dr
- 2421 NW Kingsridge Dr
- 2505 NW Kingsridge Dr
- 2509 NW Camelot Place
- 2509 NW Kingsridge Dr
- 2513 NW Camelot Place
- 2516 NW Kingsridge Dr
- 2325 NW Chatham Place
- 2513 NW Kingsridge Dr
- 1005 NW Ashton Dr
- 2326 NW Chatham Place
- 2517 NW Camelot Place