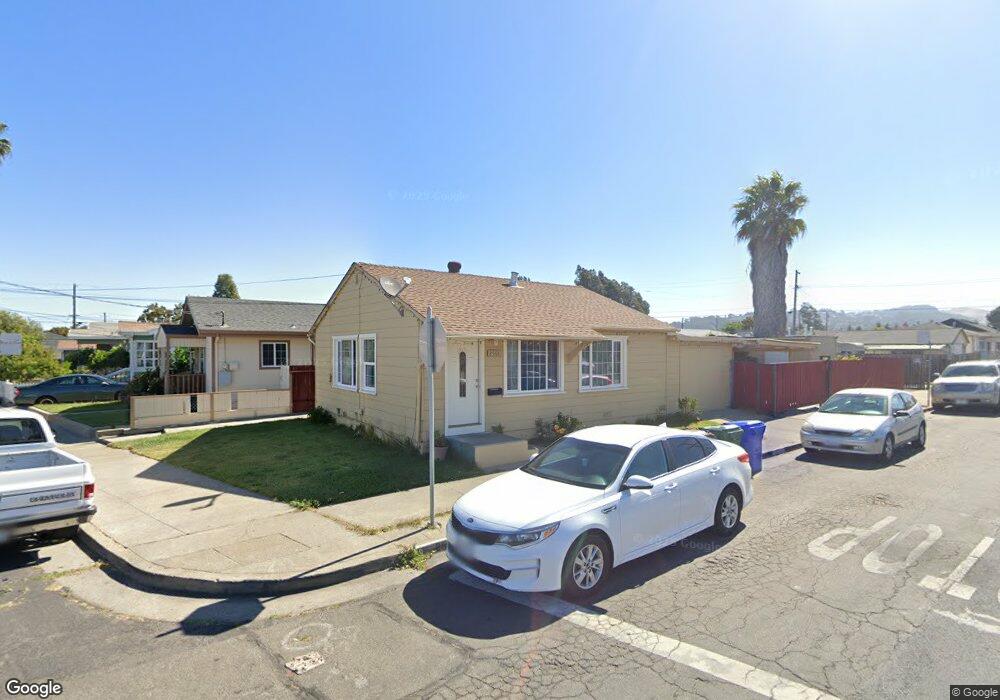
2501 Pine Ave San Pablo, CA 94806
North & East NeighborhoodEstimated Value: $409,000 - $461,865
2
Beds
1
Bath
713
Sq Ft
$624/Sq Ft
Est. Value
About This Home
This home is located at 2501 Pine Ave, San Pablo, CA 94806 and is currently estimated at $444,716, approximately $623 per square foot. 2501 Pine Ave is a home located in Contra Costa County with nearby schools including Ford Elementary School, Walter T. Helms Middle School, and Richmond High School.
Ownership History
Date
Name
Owned For
Owner Type
Purchase Details
Closed on
Apr 14, 1997
Sold by
Ledesma Jesus and Ledesma Maria
Bought by
Ramos Jose Luis and Ramos Guillermina
Current Estimated Value
Home Financials for this Owner
Home Financials are based on the most recent Mortgage that was taken out on this home.
Original Mortgage
$65,000
Outstanding Balance
$8,382
Interest Rate
7.86%
Mortgage Type
Seller Take Back
Estimated Equity
$436,334
Purchase Details
Closed on
Mar 31, 1997
Sold by
Hud
Bought by
Ledesma Jesus and Ledesma Maria
Home Financials for this Owner
Home Financials are based on the most recent Mortgage that was taken out on this home.
Original Mortgage
$65,000
Outstanding Balance
$8,382
Interest Rate
7.86%
Mortgage Type
Seller Take Back
Estimated Equity
$436,334
Purchase Details
Closed on
Dec 11, 1996
Sold by
Midfirst Bank
Bought by
Hud
Purchase Details
Closed on
Oct 23, 1996
Sold by
Joel Romo and Joel Alejandro Sandoval
Bought by
Midfirst Bank
Purchase Details
Closed on
Feb 24, 1995
Sold by
Romo Irma and Sandoval Irma
Bought by
Romo Joel
Create a Home Valuation Report for This Property
The Home Valuation Report is an in-depth analysis detailing your home's value as well as a comparison with similar homes in the area
Home Values in the Area
Average Home Value in this Area
Purchase History
| Date | Buyer | Sale Price | Title Company |
|---|---|---|---|
| Ramos Jose Luis | $29,000 | Chicago Title Co | |
| Ledesma Jesus | $60,500 | North American Title Co | |
| Hud | -- | -- | |
| Midfirst Bank | $121,610 | American Title Ins Co | |
| Romo Joel | -- | -- |
Source: Public Records
Mortgage History
| Date | Status | Borrower | Loan Amount |
|---|---|---|---|
| Open | Ramos Jose Luis | $65,000 | |
| Closed | Ledesma Jesus | $42,350 |
Source: Public Records
Tax History Compared to Growth
Tax History
| Year | Tax Paid | Tax Assessment Tax Assessment Total Assessment is a certain percentage of the fair market value that is determined by local assessors to be the total taxable value of land and additions on the property. | Land | Improvement |
|---|---|---|---|---|
| 2025 | $2,976 | $115,606 | $81,420 | $34,186 |
| 2024 | $2,945 | $113,340 | $79,824 | $33,516 |
| 2023 | $2,945 | $111,118 | $78,259 | $32,859 |
| 2022 | $2,854 | $108,940 | $76,725 | $32,215 |
| 2021 | $2,782 | $106,805 | $75,221 | $31,584 |
| 2019 | $2,596 | $103,640 | $72,991 | $30,649 |
| 2018 | $2,494 | $101,609 | $71,560 | $30,049 |
| 2017 | $2,415 | $99,617 | $70,157 | $29,460 |
| 2016 | $2,347 | $97,665 | $68,782 | $28,883 |
| 2015 | $2,303 | $96,199 | $67,749 | $28,450 |
| 2014 | $2,287 | $94,315 | $66,422 | $27,893 |
Source: Public Records
Map
Nearby Homes
- 2420 Bush Ave
- 1527 24th St
- 2376 Bush Ave
- 1337 24th St
- 2719 Bush Ave
- 1840 Pullman St
- Plan 2 at Chattleton Place
- Plan 1 at Chattleton Place
- Plan 2X at Chattleton Place
- Plan 3 at Chattleton Place
- 2801 Asher Ct
- 2805 Asher Ct
- 2809 Arjan Ct
- 2143-2147 Sanford Ave
- 2818 Chattleton Ln
- 2814 Chattleton Ln
- 2808 Chattleton Ln
- 1976 Van Ness St
- 2121 Vale Rd Unit 52
- 2121 Vale Rd Unit 121