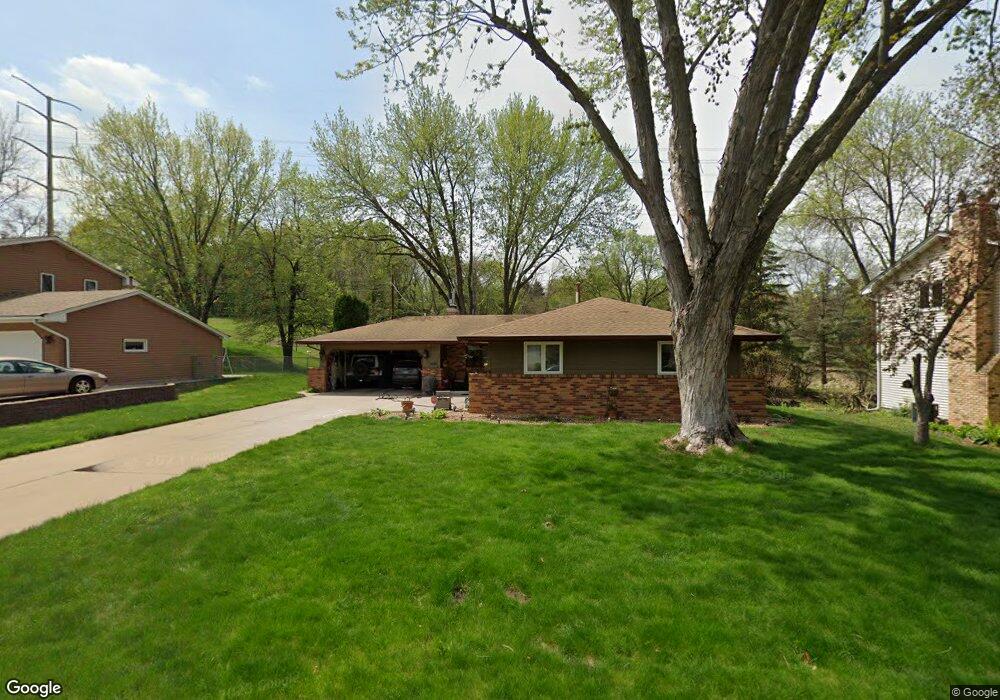
2505 Hayes Ct Burnsville, MN 55337
Estimated Value: $397,551 - $421,000
2
Beds
3
Baths
1,400
Sq Ft
$292/Sq Ft
Est. Value
About This Home
This home is located at 2505 Hayes Ct, Burnsville, MN 55337 and is currently estimated at $409,388, approximately $292 per square foot. 2505 Hayes Ct is a home located in Dakota County with nearby schools including Burnsville High School, Gateway STEM Academy, and Sunrise International Montessori School.
Ownership History
Date
Name
Owned For
Owner Type
Purchase Details
Closed on
May 11, 2018
Sold by
Seashore Jason and Seashore Marilynn
Bought by
Seyfert Robert and Seyfert Barbara
Current Estimated Value
Home Financials for this Owner
Home Financials are based on the most recent Mortgage that was taken out on this home.
Original Mortgage
$122,000
Outstanding Balance
$105,287
Interest Rate
4.5%
Mortgage Type
New Conventional
Estimated Equity
$304,101
Purchase Details
Closed on
Sep 24, 2008
Sold by
Martinez Regina K
Bought by
Prudential Relocation Inc
Purchase Details
Closed on
Jul 30, 2004
Sold by
Powell Stephen G and Powell Mary B
Bought by
Martinez Regina K
Purchase Details
Closed on
Nov 30, 1998
Sold by
Jorgenson Raymond H and Jorgenson Betty Helen
Bought by
Powell Stephen G and Powell Mary B
Create a Home Valuation Report for This Property
The Home Valuation Report is an in-depth analysis detailing your home's value as well as a comparison with similar homes in the area
Home Values in the Area
Average Home Value in this Area
Purchase History
| Date | Buyer | Sale Price | Title Company |
|---|---|---|---|
| Seyfert Robert | $260,000 | Edina Realty Title Inc | |
| Prudential Relocation Inc | $230,000 | -- | |
| Martinez Regina K | $235,000 | -- | |
| Powell Stephen G | $148,500 | -- |
Source: Public Records
Mortgage History
| Date | Status | Borrower | Loan Amount |
|---|---|---|---|
| Open | Seyfert Robert | $122,000 |
Source: Public Records
Tax History Compared to Growth
Tax History
| Year | Tax Paid | Tax Assessment Tax Assessment Total Assessment is a certain percentage of the fair market value that is determined by local assessors to be the total taxable value of land and additions on the property. | Land | Improvement |
|---|---|---|---|---|
| 2024 | $4,118 | $388,600 | $87,500 | $301,100 |
| 2023 | $4,118 | $390,500 | $87,600 | $302,900 |
| 2022 | $3,422 | $384,200 | $87,400 | $296,800 |
| 2021 | $3,392 | $323,000 | $76,000 | $247,000 |
| 2020 | $3,366 | $304,900 | $70,800 | $234,100 |
| 2019 | $3,142 | $292,500 | $67,400 | $225,100 |
| 2018 | $3,165 | $262,300 | $64,200 | $198,100 |
| 2017 | $2,927 | $256,700 | $61,100 | $195,600 |
| 2016 | $3,015 | $235,700 | $58,200 | $177,500 |
| 2015 | $2,816 | $217,057 | $52,566 | $164,491 |
| 2014 | -- | $211,498 | $51,438 | $160,060 |
| 2013 | -- | $189,480 | $46,277 | $143,203 |
Source: Public Records
Map
Nearby Homes
- 11115 Carver Ct
- 11017 27th Ave S
- 11036 27th Ave S
- 2001 Woods Ln
- 2329 Explorer Ct
- 3108 Foxpoint Cir
- 10934 Southview Dr
- 3113 Chandler Ct
- 11311 W River Hills Dr
- 1601 Raleigh Dr
- 4165 Old Sibley Hwy
- 11459 Galtier Dr
- 2177 Cool Stream Cir
- 3017 Mcleod St
- 4413 Slater Rd
- 4427 Cinnamon Ridge Cir
- 4425 Cinnamon Ridge Cir
- 4463 Cinnamon Ridge Cir
- 2200 Horizon Rd
- 11900 Highland View Cir