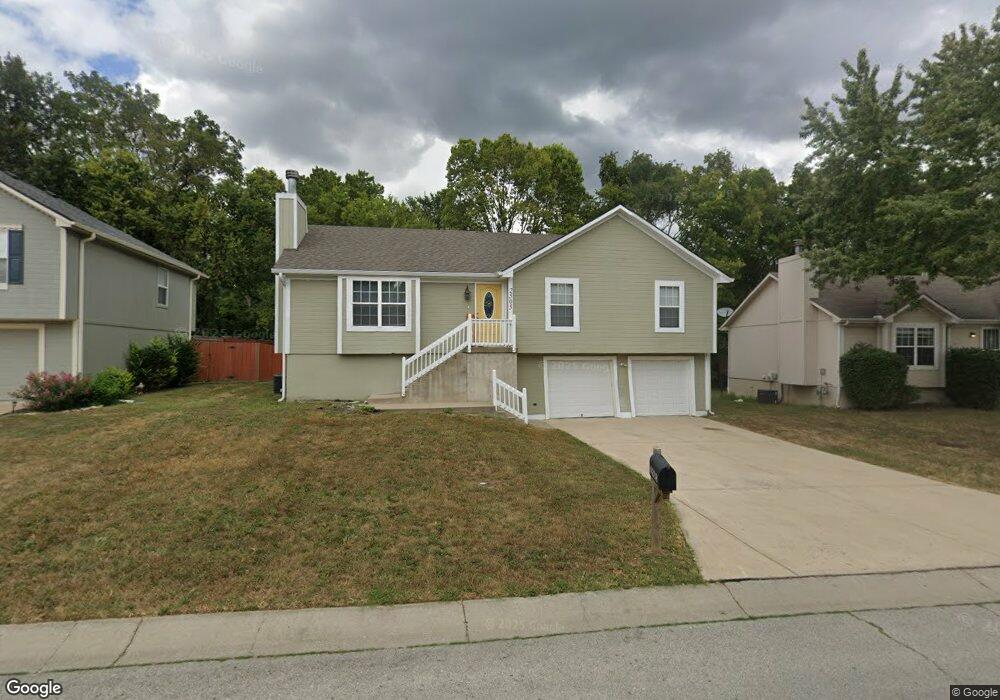
2505 NW Richard Dr Blue Springs, MO 64015
Estimated Value: $269,000 - $363,000
3
Beds
2
Baths
1,235
Sq Ft
$244/Sq Ft
Est. Value
About This Home
This home is located at 2505 NW Richard Dr, Blue Springs, MO 64015 and is currently estimated at $300,755, approximately $243 per square foot. 2505 NW Richard Dr is a home located in Jackson County with nearby schools including Thomas J. Ultican Elementary School, Paul Kinder Middle School, and Blue Springs High School.
Ownership History
Date
Name
Owned For
Owner Type
Purchase Details
Closed on
Jun 20, 2025
Sold by
Gibson Robert W and Gibson Stephen L
Bought by
Gibson Robert W and Gibson Stephen L
Current Estimated Value
Purchase Details
Closed on
May 20, 2025
Sold by
Gibson Robert W and Gibson Stephen L
Bought by
2505 Nw Richard Dr
Purchase Details
Closed on
Jun 15, 2005
Sold by
Lawrence Richard L
Bought by
Gibson Margaret L
Home Financials for this Owner
Home Financials are based on the most recent Mortgage that was taken out on this home.
Original Mortgage
$104,000
Interest Rate
5.78%
Mortgage Type
Fannie Mae Freddie Mac
Purchase Details
Closed on
Feb 16, 2004
Sold by
Davis Homes Inc
Bought by
Lawrence Richard L
Home Financials for this Owner
Home Financials are based on the most recent Mortgage that was taken out on this home.
Original Mortgage
$96,800
Interest Rate
5.86%
Mortgage Type
Purchase Money Mortgage
Create a Home Valuation Report for This Property
The Home Valuation Report is an in-depth analysis detailing your home's value as well as a comparison with similar homes in the area
Home Values in the Area
Average Home Value in this Area
Purchase History
| Date | Buyer | Sale Price | Title Company |
|---|---|---|---|
| Gibson Robert W | -- | None Listed On Document | |
| 2505 Nw Richard Dr | -- | None Listed On Document | |
| Gibson Margaret L | -- | Old Republic Title Company | |
| Lawrence Richard L | -- | Ati Title Company |
Source: Public Records
Mortgage History
| Date | Status | Borrower | Loan Amount |
|---|---|---|---|
| Previous Owner | Gibson Margaret L | $104,000 | |
| Previous Owner | Lawrence Richard L | $96,800 |
Source: Public Records
Tax History Compared to Growth
Tax History
| Year | Tax Paid | Tax Assessment Tax Assessment Total Assessment is a certain percentage of the fair market value that is determined by local assessors to be the total taxable value of land and additions on the property. | Land | Improvement |
|---|---|---|---|---|
| 2025 | $3,793 | $38,194 | $5,784 | $32,410 |
| 2024 | $3,793 | $46,493 | $5,580 | $40,913 |
| 2023 | $3,720 | $46,493 | $7,385 | $39,108 |
| 2022 | $2,615 | $28,880 | $6,660 | $22,220 |
| 2021 | $2,612 | $28,880 | $6,660 | $22,220 |
| 2020 | $2,450 | $27,551 | $6,660 | $20,891 |
| 2019 | $2,750 | $31,992 | $6,660 | $25,332 |
| 2018 | $2,426 | $27,162 | $4,022 | $23,140 |
| 2017 | $2,426 | $27,162 | $4,022 | $23,140 |
| 2016 | $2,239 | $25,137 | $5,301 | $19,836 |
| 2014 | $1,996 | $22,334 | $5,546 | $16,788 |
Source: Public Records
Map
Nearby Homes
- 2508 NW Castle Dr
- 2317 NW Kensington Ct
- 913 NW Camelot Ct
- 516 NW Mill Ct
- 2916 NW Chelsea Place
- 2804 NW Kingsridge Dr
- 1029 NW Berkshire Dr
- 124 SW 27th St
- 3213 NW Canterbury Place
- 3212 NW Canterbury Rd
- 216 SW 26th St
- 305 NW 17th St
- 2000 SW Smith St
- 503 NW 15th St
- 1389 NW Jefferson Ct
- 308 SW Woods Chapel Rd
- 1705 SW Walnut St
- 3012 SW Moore St
- 41 Clipper Dr
- 3605 NW Dogwood Dr
- 2509 NW Richard Dr
- 2501 NW Richard Dr
- 2513 NW Richard Dr
- 2413 NW Richard Dr
- 2517 NW Richard Dr
- 2412 NW Richard Dr
- 2512 NW Castle Dr
- 2516 NW Castle Dr
- 2520 NW Castle Dr
- 536 NW Panther Dr
- 2409 NW Richard Dr
- 2521 NW Richard Dr
- 2524 NW Castle Dr
- 2408 NW Richard Dr
- 2504 NW Castle Dr
- 2500 NW Castle Dr
- 2600 NW Castle Dr
- 2601 NW Richard Dr
- 2405 NW Richard Dr
- 2404 NW Richard Dr