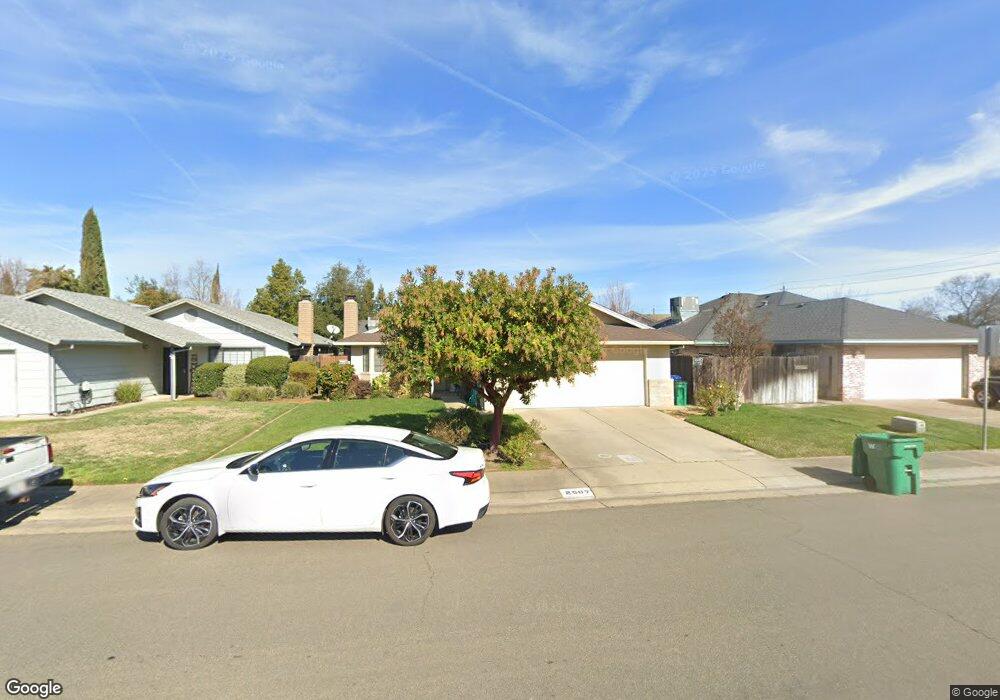
2507 Parkwest Dr Lodi, CA 95242
Sunwest NeighborhoodEstimated Value: $481,921 - $578,000
3
Beds
2
Baths
1,229
Sq Ft
$427/Sq Ft
Est. Value
About This Home
This home is located at 2507 Parkwest Dr, Lodi, CA 95242 and is currently estimated at $524,480, approximately $426 per square foot. 2507 Parkwest Dr is a home located in San Joaquin County with nearby schools including Erma B. Reese Elementary School, Millswood Middle School, and Lodi High School.
Ownership History
Date
Name
Owned For
Owner Type
Purchase Details
Closed on
Jun 11, 2015
Sold by
Hatfield David A and Hatfleid Kimberly R
Bought by
Raygoza Gabriela L and Raygoza Gabriel
Current Estimated Value
Home Financials for this Owner
Home Financials are based on the most recent Mortgage that was taken out on this home.
Original Mortgage
$283,765
Outstanding Balance
$220,721
Interest Rate
3.87%
Mortgage Type
FHA
Estimated Equity
$303,759
Purchase Details
Closed on
Aug 29, 2012
Sold by
Ghc Inc
Bought by
Hatfield David A and Hatfield Kimberly R
Purchase Details
Closed on
Apr 26, 2012
Sold by
Woods Kevin M and Woods Evelyn
Bought by
Ghc Inc
Purchase Details
Closed on
Jun 26, 1998
Sold by
Crystal Enterprises
Bought by
Woods Kevin M and Woods Evelyn
Home Financials for this Owner
Home Financials are based on the most recent Mortgage that was taken out on this home.
Original Mortgage
$130,720
Interest Rate
7.17%
Mortgage Type
FHA
Create a Home Valuation Report for This Property
The Home Valuation Report is an in-depth analysis detailing your home's value as well as a comparison with similar homes in the area
Home Values in the Area
Average Home Value in this Area
Purchase History
| Date | Buyer | Sale Price | Title Company |
|---|---|---|---|
| Raygoza Gabriela L | $289,000 | Old Republic Title Company | |
| Hatfield David A | -- | Chicago Title Company | |
| Ghc Inc | $139,215 | None Available | |
| Woods Kevin M | $132,000 | Old Republic Title Company |
Source: Public Records
Mortgage History
| Date | Status | Borrower | Loan Amount |
|---|---|---|---|
| Open | Raygoza Gabriela L | $283,765 | |
| Previous Owner | Woods Kevin M | $130,720 |
Source: Public Records
Tax History Compared to Growth
Tax History
| Year | Tax Paid | Tax Assessment Tax Assessment Total Assessment is a certain percentage of the fair market value that is determined by local assessors to be the total taxable value of land and additions on the property. | Land | Improvement |
|---|---|---|---|---|
| 2025 | $3,769 | $347,322 | $138,206 | $209,116 |
| 2024 | $3,666 | $340,513 | $135,497 | $205,016 |
| 2023 | $3,624 | $333,838 | $132,841 | $200,997 |
| 2022 | $3,544 | $327,293 | $130,237 | $197,056 |
| 2021 | $3,608 | $320,877 | $127,684 | $193,193 |
| 2020 | $3,514 | $317,588 | $126,375 | $191,213 |
| 2019 | $3,443 | $311,362 | $123,898 | $187,464 |
| 2018 | $3,395 | $305,258 | $121,469 | $183,789 |
| 2017 | $3,320 | $299,274 | $119,088 | $180,186 |
| 2016 | $3,112 | $293,408 | $116,754 | $176,654 |
| 2014 | -- | $190,862 | $47,213 | $143,649 |
Source: Public Records
Map
Nearby Homes
- 2526 Park West Dr
- 2633 Bayberry Dr
- 406 Whitney St
- 2408 Tejon St
- 2651 Douglas Fir Dr
- 208 Palomar Dr
- 2816 Applewood Dr
- 2161 W Elm St
- 2662 Veneto Ct
- 324 Applewood Dr
- 2670 Manza Ct
- 991 Harvest Crossing St
- 2107 Yosemite Dr
- 2937 Heritage Oak Way
- 2131 Jerry Ln
- 2438 Central Park Dr
- 2145 W Pine St
- 2355 Woodlake Cir
- 1111 Brighton Way
- 3021 Belmont Dr
- 2507 Park West Dr
- 2511 Park West Dr
- 401 N Lower Sacramento Rd
- 2519 Park West Dr
- 2516 Cottonwood Dr
- 2510 Cottonwood Dr
- 2522 Cottonwood Dr
- 2525 Park West Dr
- 2508 Park West Dr
- 2514 Park West Dr
- 2528 Cottonwood Dr
- 2504 Cottonwood Dr
- 2520 Park West Dr
- 315 N Lower Sacramento Rd
- 2534 Cottonwood Dr
- 2533 Park West Dr
- 2526 Park Dr W
- 2534 Park West Dr
- 2534 Park West Dr
- 2529 Alder Glen Dr