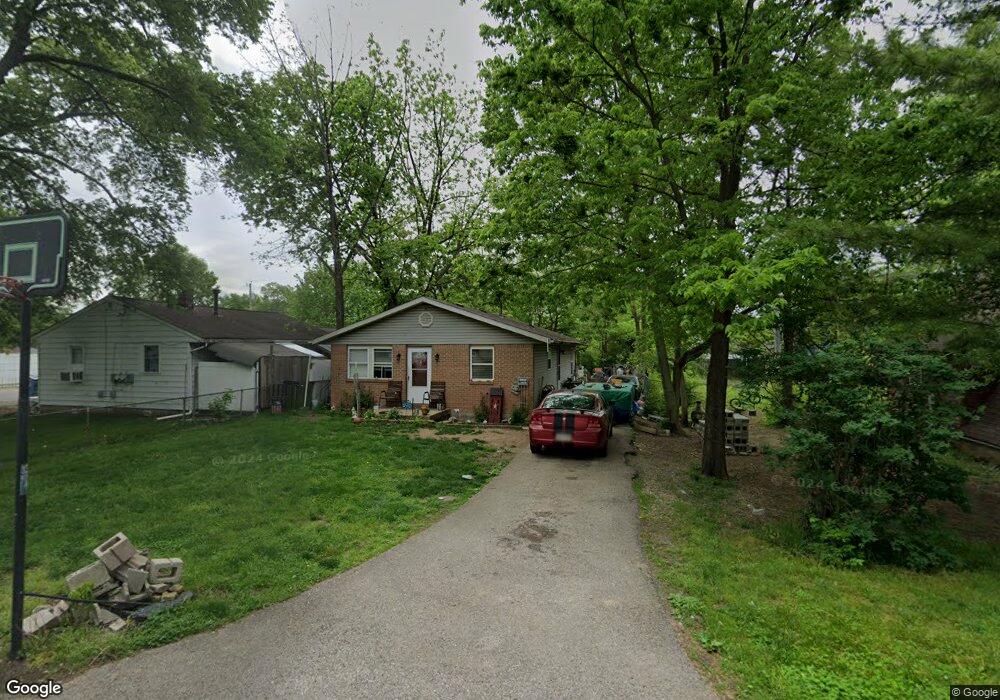
2507 Rondowa Ave Dayton, OH 45404
Avondale NeighborhoodEstimated Value: $127,815 - $148,000
3
Beds
1
Bath
1,040
Sq Ft
$133/Sq Ft
Est. Value
About This Home
This home is located at 2507 Rondowa Ave, Dayton, OH 45404 and is currently estimated at $137,954, approximately $132 per square foot. 2507 Rondowa Ave is a home located in Montgomery County with nearby schools including Stebbins High School, Pathway School of Discovery, and Liberty High School.
Ownership History
Date
Name
Owned For
Owner Type
Purchase Details
Closed on
Jun 26, 2001
Sold by
Herzog Kimberly A and Herzog Martin S
Bought by
Richards Michael W and Richards Michael W
Current Estimated Value
Home Financials for this Owner
Home Financials are based on the most recent Mortgage that was taken out on this home.
Original Mortgage
$66,850
Outstanding Balance
$25,837
Interest Rate
7.18%
Mortgage Type
FHA
Estimated Equity
$112,117
Purchase Details
Closed on
Aug 4, 1999
Sold by
Bank One Na
Bought by
Herzog Kimberly A
Home Financials for this Owner
Home Financials are based on the most recent Mortgage that was taken out on this home.
Original Mortgage
$59,867
Interest Rate
7.61%
Mortgage Type
FHA
Purchase Details
Closed on
Nov 6, 1998
Sold by
Cantrell Lonnie R
Bought by
Bank One Na
Purchase Details
Closed on
Nov 4, 1998
Sold by
Cantrell Lonnie R
Bought by
Bank One Na
Create a Home Valuation Report for This Property
The Home Valuation Report is an in-depth analysis detailing your home's value as well as a comparison with similar homes in the area
Home Values in the Area
Average Home Value in this Area
Purchase History
| Date | Buyer | Sale Price | Title Company |
|---|---|---|---|
| Richards Michael W | $67,900 | -- | |
| Herzog Kimberly A | $60,000 | -- | |
| Bank One Na | $50,000 | -- | |
| Bank One Na | $50,000 | -- |
Source: Public Records
Mortgage History
| Date | Status | Borrower | Loan Amount |
|---|---|---|---|
| Open | Richards Michael W | $66,850 | |
| Previous Owner | Herzog Kimberly A | $59,867 |
Source: Public Records
Tax History Compared to Growth
Tax History
| Year | Tax Paid | Tax Assessment Tax Assessment Total Assessment is a certain percentage of the fair market value that is determined by local assessors to be the total taxable value of land and additions on the property. | Land | Improvement |
|---|---|---|---|---|
| 2024 | $1,433 | $29,710 | $4,490 | $25,220 |
| 2023 | $1,433 | $29,710 | $4,490 | $25,220 |
| 2022 | $1,530 | $23,760 | $3,590 | $20,170 |
| 2021 | $1,558 | $23,760 | $3,590 | $20,170 |
| 2020 | $1,558 | $23,760 | $3,590 | $20,170 |
| 2019 | $1,687 | $23,000 | $3,230 | $19,770 |
| 2018 | $1,690 | $23,000 | $3,230 | $19,770 |
| 2017 | $1,690 | $23,000 | $3,230 | $19,770 |
| 2016 | $1,674 | $22,110 | $3,590 | $18,520 |
| 2015 | $1,782 | $22,110 | $3,590 | $18,520 |
| 2014 | $1,782 | $22,110 | $3,590 | $18,520 |
| 2012 | -- | $19,510 | $3,590 | $15,920 |
Source: Public Records
Map
Nearby Homes
- 2460 Bushnell Ave
- -- Valley Pike
- - Valley Pike
- 2249 - Valley Pike
- 2301 Valley Pike
- 546 Wynora Ave
- 518 Tyron Ave
- 2249 Prince Albert Blvd
- 2249 Valley Pike
- - Prince Albert Blvd
- -- Prince Albert Blvd
- 2245 Valley Pike
- - Rondowa Ave
- -- Rondowa Ave
- 641 Prince Albert Blvd
- 29 Barcelona Ave
- 3586 Lane Garden Ct
- 1930 Brandt Pike
- 241 Community Dr
- 620 Homecrest Ave
- 2501 Rondowa Ave
- 2509 Rondowa Ave
- 346 Rohrer Blvd
- 2517 Rondowa Ave
- 2459 Rondowa Ave
- 2504 Bushnell Ave
- 2508 Rondowa Ave
- 2500 Bushnell Ave
- 2521 Rondowa Ave
- 2512 Rondowa Ave
- 2500 Rondowa Ave
- 2457 Rondowa Ave
- 2524 Bushnell Ave
- 2525 Rondowa Ave
- 2449 Rondowa Ave
- 2458 Bushnell Ave
- 2522 Rondowa Ave
- 2445 Rondowa Ave
- 2530 Bushnell Ave
- 2448 Rondowa Ave